Safety
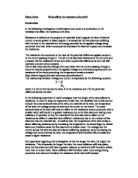
To make this experiment safe I will: -
- Place the experiment in the centre of the table so that nothing will fall off
- Remove unnecessary equipment from the table i.e. pencil case
- Remove bags from under the table so that no one trips over them
- Not touch the wire when the power pack is on!
- Make sure plugs are pushed in properly and wires are not dangling so there less chance of being electrocuted
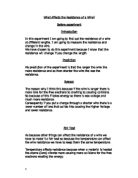
Reliability
To make this experiment as reliable as possible I will try and follow a fair test and repeat the experiment a few times to confirm my results. There are only a few flaws in my experiment: -
- The length of the wire may be very slightly inaccurate because the wire may stretch slightly when we pull it to get the (originally curled) wire straight against the ruler.
- The temperature in the room may change very slightly
- The connecting leads in the circuit have their own resistance
But by doing the following our results should be fairly reliable: -
- Measuring accurately
- Using the same equipment
- Redoing the experiments
Preliminary Work
I tried this experiment on a digital laptop using the Standard Wire Gauge values of 28, 30, 32, 36, and 40. These results are theoretical results programmed in to the computer and can be found in textbooks too. This is the results table:
I chose to use this range on the laptop because these are the only sizes of constantan wires we have in school and so I have to use those in the actual experiment. For that reason I did those values on the laptop. I am happy with the range because the results are well spread, therefore producing a clear graph. From these results and graph, I can make a prediction for my actual experiment.
Range
I will use the following of Standard Wire Gauge values because they give me a good range and I am happy with the spread of the theoretical values they gave me in my preliminary work. There is the right amount of readings to make an accurate conclusion. I also have to use this range because these are the only sizes of constantan wires we have in school. Here are the SWG values and their diameters.
Secondary Data
I used some textbooks at school, the BBC bitesize revision website, and the Revise for Science GCSE: Suffolk Higher Tier revision book to help me with my prediction. I also used Lessons in Electric circuits by Tony R. Kuphaldt, which I found on the Internet, that says:
The formula for calculating the circular-mil area of a circular wire is very simple:
Circular Wire Area Formula A=d2
Because this is a unit of area measurement, the mathematical power of 2 is still in effect (doubling the width of a circle will always quadruple its area, no matter what units are used, or if the width of that circle is expressed in terms of radius or diameter). Electrons flow through large-diameter wires easier than small-diameter wires, due to the greater cross-sectional area they have in which to move.
Prediction
Electricity flows in metals. Metal wires are made of millions of tiny metal crystals. Each crystal’s atoms are arranged in a regular pattern. The metal is full of ‘free’ electrons that do not stick to any particular atom. They fill the space between atoms in the metal. There is an electric current when these electrons move. Metal atoms get in the way of travelling electrons. This causes electrical resistance. Some conductors are worse than others because they have more resistance to current. The free electrons keep bumping into atoms. A wire’s resistance depends on the metal. Constantan is a copper-nickel alloy with a high electrical resistance and is used as a resistance wire. The resistance also depends on the wire’s size. The overall resistance is more when you connect the wires in series (twice the resistance of one wire). The overall resistance is less when you connect the wires in parallel (1/2 the resistance of one wire) because more current can pass through two wires, and with an increase in current the resistance goes down. The Standard Wire Gauge works as so: The larger the gauge number, the thinner the wire; the smaller the gauge number, the fatter the wire. This is an inversely proportional measurement scale. Ohm’s law says that ‘the current flowing through a component is proportional to the potential difference between its ends, providing temperature is constant.’
From this information I predict that as the diameter of the wire decreases (the SWG increase), the resistance of the wire increases. I think this is because a wire with a diameter twice the size of another wire would have 4 times as much wire. This is like having 4 wires in parallel, which means there are more pathways for the current to pass through. The more electrons would be able to pass through the larger wire at any one time and because there is an increase in current the resistance goes down (because of the equation R=V/I) This means that there will be ¼ of the smaller wire’s resistance in the larger wire. I can therefore predict the graph to look like this because if a diameter of 1mm equalled 16Ω/m, 2mm would equal 4Ω/m, and 4mm would equal 1Ω/m, giving a curvy graph:
These are my predictions for each of the Standard Wire Gauges: -
- For a metre of 28 SWG constantan wire I predict that the resistance will be around 4.32Ω/m because that is the theoretical value I found from my preliminary work, and because the diameter is very large, and so a lot of current passes through the wire, so the resistance is therefore very low.
- For 30 SWG I predict that the resistance will be around 6.16Ω/m because the wire is thinner and so the current is a little less, therefore the resistance is more than for 28 SWG. The theoretical value shown in my preliminary work is 6.16Ω/m.
- For 32 SWG I predict that the resistance will be around 8.12Ω/m because the wire is quite thin and so the current is a less, therefore the resistance is higher than for 30 SWG. And the theoretical value shown in my preliminary work is 8.12Ω/m.
- For 36 SWG I predict that the resistance will be roughly 4 times more than the resistance of 28 SWG because the diameter is roughly half of the diameter of 28 SWG. The wire is thin and so the current is a lot less, therefore the resistance is a lot more than for 28 SWG. The theoretical value shown in my preliminary work is 16.40Ω/m.
- For 40 SWG I predict that the resistance will be around 41.10Ω/m because the wire is extremely thin and so the current is very small, therefore the resistance is very high compared to 28 SWG. And the theoretical value shown in my preliminary work is 41.10Ω/m.
Obtaining Evidence
Following my method I have carefully and safely done three experiments and collected some results. I recorded the results as precisely as possible.
This is the results table for my first experiment: -
This is the results table for my second experiment: -
This is the results table for my third experiment: -
I have done three experiments to make my results even more accurate and to make sure I have no odd results.
I worked out the resistance using the following formula:
Resistance = Voltage ÷ Current
The results from the repeated experiments confirm the reliability of the original data because they are similar results showing a similar pattern. Using the results a have obtained I can find the average resistances and use these to produce an accurate and reliable graph.
These are the average resistances of the two experiments: -
This table confirms the reliability of my results because it shows how close my results are to the theoretical values. I have drawn a graph using the data in the table above comparing the average and theoretical results.
I have also worked out the percentage error of my averaged results using the following formula:
Actual resistance x 100 = % error
Theoretical resistance
These are the percentage errors: -
These show precisely how accurate my results were. And the graph backs this up.
Analysis
I have found from my results that 28 SWG constantan wire has the smallest resistance on average of 4.34Ω/m and 40 SWG constantan wire has the largest resistance on average of 40.95. I have found that as the Standard Wire Gauge increases the resistance increases too, which means that as the diameter increase the resistance decreases because a high SWG is a thin wire and a low SWG is a thick wire. The graph clearly shows this trend with a curve that slopes upwards and gets steeper at the end. The graph shows a positive correlation between SWG and resistance. The gradient changes in my graph, as the x-axis (SWG) gets bigger the gradient becomes steeper. This is because the resistance multiplies by four when the wire is twice as thin. As the wire gets thinner the current bumps into more atoms and flows less easily and so the resistance gets really high. And the resistance gets higher and higher as the wire gets thinner, each time the resistance rising by greater amounts.
I have found that the wire’s resistance increases as the SWG increases (diameter decreases). This is related to the fact that more current can pass through thicker wires because with an increase in current the resistance goes down.
- The 28 SWG wire’s resistance was 4.34Ω/m on average. This is because the diameter is very large, and so a lot of current passes through the wire, so the resistance is therefore very low.
- The 30 SWG wire’s resistance was 6.44Ω/m on average. This is because the diameter is quite large, and so quite a bit of current passes through the wire, so the resistance is therefore low.
- The 32 SWG wire’s resistance was 8.58Ω/m on average. This is because the diameter is thinner than the 28 SWG wire, and less current passes through the wire, so the resistance is therefore higher.
- The 36 SWG wire’s resistance was 17.13Ω/m on average. This is almost four times as much as the resistance for the 28 SWG wire because it is about half the size in diameter. The diameter is small, and only a small amount of current passes through the wire, so the resistance is therefore high.
- The 40 SWG wire’s resistance was 40.95Ω/m on average. This is because the diameter is very small, and so hardly any current passes through the wire, so the resistance is therefore very high.
The following diagrams show the wires and the flow of the electrons through them, showing mini hurdles as the resistance.
What I have found out is extremely similar to what I originally predicted. The results are very close to the theoretical values, within 10% either way. The shape of my predicted graph is the same as the one produced from my results and the analysis of my results agrees with my prediction.
Evaluation
I think that this investigation was successful because my results collaborated with my prediction. The method I used was good because it was easy to set up and also straightforward and safe to do. It has produced very accurate and reliable results. I know this because the results in all three experiments were very similar and followed the same pattern. I think that most of my results are accurate enough because the wires were measured using a suitable ruler and the voltmeter and the ammeter measured to two decimal places instead of rounding up to a whole number. I think the procedure was very suitable for the investigation but the results would have been even more reliable if we could have used an ohmmeter instead of a voltmeter and ammeter because I may have read either the voltmeter or ammeter wrong some of the times (as the numbers often changed all the time).
I didn’t have any odd results and all of them are accurate. The graph shows this by showing how close they all are to the theoretical values. I didn’t have any problems with my investigation and everything went smoothly as I planned. I followed my method exactly and tried to measure everything as precisely as possible. I think that my results are good enough to make a firm conclusion because they seem reliable. I don’t need any more results to make my conclusion more definite because I have already done the experiment three times and my graph shows clearly that the results are good.
I have come to the conclusion that the diameter affects the resistance of the wire and as the diameter of the wire decreases the resistance of the wire increases. I have also found out that this happens because the thicker wire has more passage for the current to flow through and so more current can flow at a time, therefore the current is high meaning that the resistance is low in a thick wire, and vice versa. I have been measuring the diameter using the Standard Wire Gauge scale. To further confirm my conclusion if I had the equipment I could use an equally spread out range of wires instead of making do with the ones I had e.g. 28,32,36,40,44 SWG. I could repeat the experiment a few more times, try the experiment with other materials to make sure the diameter has the same affect on the resistance on all wires, try the experiment using American Wire Gauge measurements, or try the experiment with other diameters.