How effectively the enzyme amylase breaks down starch into glucose
Rough plan, reason and prediction
Planning
The aim of this experiment is to investigate how effectively the enzyme amylase breaks down starch into glucose (to be used for respiration), at different temperatures, and therefore to find the optimum temperature of amylase.
This experiment is a perfect example of digestion at least for the first stage. The first stage is both chemical and mechanical digestion. The amylase breaking down the starch is chemical but your teeth chewing the food is mechanical.
The background theory relevant to this investigation involves enzymes in general, amylase itself and kinetic theory.
Amylase is an enzyme found in various places in the body, mostly in the saliva and the pancreas. It acts on starch, a polysaccharide, breaking it down into maltose, a disaccharide, or glucose.
The above diagram shows how the enzyme and substrate fit together exactly like a lock and key. Each enzyme and substrate are made for each other and are specific.
Enzymes are a type of protein, which catalyze chemical reactions. Unlike non -biological catalysts such as charcoal or platinum, which often need harsh extremes of temperature and pH, enzymes must work in the mild conditions of a cell in the body, at approximately 40oC and at a pH between 6.5 and 7.5.
I predict that the amylase would break down the starch most effectively at 40oC, and with decreasing efficiency towards 0oC, at which time the amylase would be unable to break down the starch at all. This is because body temperature is around 40oC, and enzymes are designed to work at this optimal temperature. At temperatures over 40oC, it was predicted, the amylase would begin to denature to an extent that, at temperatures much over 50oC, it would be totally ineffective.
. I plan to determine the exact range of temperatures to test and the volumes of starch and amylase to use after conducting a preliminary test. Though in my preliminary test I will use 10cm3 of amylase and 10cm3 of starch
The independent variable was temperature, controlled during the experiment. The variable dependant on this was the amount of starch when mixed with iodine. All other variables therefore had to be kept constant to ensure that the experiment was a fair test. The volume of amylase and starch would stay the same throughout, the same person checked the iodine colouring throughout all our tests to ensure that each other's eyesight and different perception of colours had no affect on the results of our experiments. The equipment was also kept the same throughout.
I then decided to conduct the experiment as follows: Two test tubes would be taken, with equal amounts of starch and amylase solution. The contents of the two tubes would then be combined in a separate tube, and a timer started. Then, every 30 seconds, a sample of the mixture would be taken using a pipette, and placed on a spotting tile. A drop of iodine would be added to each drop. I planned to determine the range of temperatures to test and the volumes of starch and amylase solutions to use after conducting a preliminary test.
These are the results from my preliminary test:
Temperature (oC)
Time taken for starch to disappear
20
1
70
denatures
From these results I can assume that any temperature above 70 oC the enzyme would denature and other temperatures below it like 60 oC or even50 oC would denature.
After the preliminary test had been carried out, I decided to use 10cm3 of 2% starch solution and 10cm3 of 0.01% amylase solution in the two initial test tubes for the main experiment. It proved easier to, before the experiment was ...
This is a preview of the whole essay
These are the results from my preliminary test:
Temperature (oC)
Time taken for starch to disappear
20
1
70
denatures
From these results I can assume that any temperature above 70 oC the enzyme would denature and other temperatures below it like 60 oC or even50 oC would denature.
After the preliminary test had been carried out, I decided to use 10cm3 of 2% starch solution and 10cm3 of 0.01% amylase solution in the two initial test tubes for the main experiment. It proved easier to, before the experiment was started and while the starch and amylase were heating up, set up a tile with iodine drops already on it. A drop of the solution collected during the experiment could then simply be added to this. In order to decide at which point there was no more starch present, glucose solution was mixed with iodine in a beaker. This provided an indication of what colour the iodine would turn if there was no starch present, but there was glucose, produced by the enzyme. Based on the preliminary test results, I decided to conduct the main experiment between temperatures of 20oC and 70oC inclusive. The preliminary test showed that 20oC was the lowest temperature at which the enzyme could function at all effectively and that the enzyme would denature possibly at 70oC and definitely at temperatures above that. The main experiment would be conducted at 10oC intervals between these temperatures in order to obtain an adequate number of sufficiently different results.
Throughout the experiment, safety precautions would taken to ensure that the experiment was conducted in a safe style: safety goggles and an apron would be worn at all times. All parts of the experiment would be undertaken with care, to ensure that there was no spillage. Any spillage's of iodine or starch would be washed thoroughly with soap and water. If any starch solution, iodine indicator or amylase was accidentally ingested, medical attention would be sought immediately. To make my experiment even safer I will be using a water bath for most of the temperatures, unfortunately this can not be done for all of them since water baths are not able to succeed in reaching high temperatures. Water baths are a safer option than the normal Bunsen burner method and often more effective. Less equipment to deal with, heat not as extreme and no open flames equal less of a chance for accidents. They are often more effective because the temperature of the water can be controlled more easily and the heat gradually increases, unlike the Bunsen burner method where it is very difficult to control the heat. The heat increase is almost instant and low temperatures are hard to achieve because of the severe concentration of heat
I will need this equipment:
* Test-tubes
* Thermometers
* Dropping pipettes
* Spotting tiles
* Amylase solution
* Starch solution
* Iodine solution
* Beaker 100ml
* Bunsen burner, tripod, gauze, heat-proof mat
* Stop clock
* Water baths
The equipment was set up as follows:
To get my results I will measure two preferences, temperature and the time taken for the amylase and starch solution to have no prominent color change on the iodine. For time I will measure every 30 seconds as to get quite precise results. If it was every 5seconds or less it would be very difficult and I would have to use more iodine, amylase + starch solution and spotting tiles to test on.
Obtaining Evidence
The following results were obtained:
Temperature (oC)
Time taken for starch to disappear
test
2 test
Average
20
9
5
2
30
7
0
8.5
40
5
6
5.5
50
6
0
8
60
6*
2
2
70
6*
Denatures
Denatures
* these anomalous results omitted from averages
Analysing Evidence
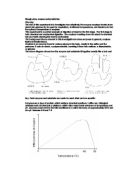
Starch was plotted on the y-axis, with temperature on the x-axis:
The graph shows that, at MY STARTING TEMPERATURE of 20?C the graph line rose quite steadily until at the temperature of 30?C when the steepness of the line rose much more considerably. But with temperatures over40?the speed at which the starch was turned to glucose began to slow down until after 60?C at which the enzymes in the amylase denatured and failed to work completely, therefore stopping the reaction between the starch and amylase. Therefore I believe that temperatures of 20oC and 40oC, the efficiency of the enzyme increases with temperature. However, the graph between these points is a curve so the efficiency of the enzyme is not equal to the temperature. Between 40oC and 60oC, the efficiency of the enzyme decreases with temperature, mirroring the first part of the graph. The graph shows that the optimum temperature of the amylase tested was 40oC.
The graph supports my prediction that the optimum temperature of the enzyme would be around 40oC, and would have decreasing efficiency towards 0oC, at which the amylase would be unable to break down the starch at all. However, the results did not support the prediction that, at temperatures over 40oC, the enzyme would begin to denature to an extent that, at temperatures much over 50oC, it would be totally ineffective. The reason why the enzyme seems to have been able to survive without denaturing at higher temperatures is that the enzyme used was a bacterial enzyme, and bacterial enzymes do not necessarily behave in the same way as enzymes from the human body. It therefore could have had an optimum temperature of slightly above 40oC, and did not fully denature until the temperature was raised to 70oC, as shown in the results table above.
The reason for this behaviour of the enzyme shown in the graph involves theory concerning enzymes in general, amylase itself and kinetic theory.
Kinetic theory is the idea that, when a substance is heated, its molecules, having been supplied with energy, move around faster. In this experiment, as the temperature increased, the enzyme and starch molecules collided more frequently (Collision Theory) and with more energy which caused them to react more efficiently. At low temperatures, the molecules did not collide as frequently and the starch was therefore not broken down as quickly. This is true of any reaction, whether or not it involves catalysts, biological or otherwise.
The enzyme was most effective at 40oC because this is body temperature, at which is it most used to working. In order for it to function most efficiently in the body, amylase must have an optimum temperature of 40oC. The reason why the amylase was less effective at higher temperatures was that it had started to denature. All enzymes start to denature at temperatures above their optimum temperatures, which renders them unable of catalysing reactions.
Evaluating Evidence
The experiment worked well overall, proving that the optimum temperature of the amylase used in the experiment was around 40oC. Despite the erratic nature of the experiment, the results were sufficiently accurate that they were aligned almost perfectly on a curve, and were taken at intervals far enough apart that the readings were clearly distinguishable from each other.
However, the results were not totally accurate. For example, the first time the experiment was carried out at 70oC, the starch disappeared in six minutes, while the second time the enzyme denatured quickly. At 60oC, the second time the experiment was conducted at this temperature, the start took twice as long (12 minutes) to disappear. The graph was not a perfectly smooth curve, and this was due to several different factors.
The apparatus used could have been improved in many ways. The water baths used were not all at the exact temperatures required, and each contained a different amount of water. If better quality water baths had been used, and there was time to ensure that each had exactly the same amount of water and was at the exact temperature required, anomalous results could have been eliminated. This could also have been achieved by repeating the experiment for each temperature more than twice, and also by performing the experiment at intervals smaller than 10oC. Another problem with the experiment was the use of iodine. Although iodine is a good indicator of whether or not starch is present, it does not provide accurate information about the concentration of starch present. It would have been more useful to obtain this information so that it could be plotted, to analyse how the concentration changes over time rather than at what single time there is no more starch. This quantitative approach could have been achieved by using a colorimeter. This device provides an indication of how deep a colour is, and could have been used to measure the index of concentration of the samples throughout the experiment. Values for concentration of starch in the samples could have been obtained by first recording a reading for known concentrations, then comparing these readings with those obtained with the samples collected during the experiment.
Additionally, the pipettes used were another area of error. More accurate results could have been obtained by cleaning the pipette between each reading, or using a new pipette each time, but this could not practically happen. There was always some solution left over in the pipette from the previous reason. Another problem with the pipettes was that there was time for the amylase to act on the starch while the solution was in the pipette, making the timings recorded slightly too small. However, this effect was lessened with most of the temperatures as the mixture was cooling down to room temperature in the pipette. The method by which we tested to see if there was starch remaining did not work entirely satisfactorily. Maltose was mixed with iodine to give an indication of what colour the solution would turn when there was no remaining starch, and the resulting colour was yellow. However, with the samples collected, this colour was never reached and the readings were stopped after the solution turned a yellow/brown colour and stayed that colour. Had the experiment been undertaken with greater precision, it is likely that the yellow colour would have been reached. Finally, the procedure of preparing the solutions of amylase and starch for the experiment could have been improved. It is likely that there was some solution left over from the previous repetition of the experiment, making the starch/amylase ratio different each time. This could have been overcome by washing out the test tubes between readings. The volumes of each solution could have been made more accurate by measuring the solutions using a narrower gauge measuring tube or by using a syringe.
An ideal solution would have been to automate the whole system, with a sample of the mixture being automatically taken every minute, or preferably more frequently, and the concentration of starch stored on computer. This would have overcome the inaccuracies of the timing, which could not always be exact using a stop clock and someone watching it, and would have eliminated the effect of human error from the experiment. If these steps had been taken, it is likely that a graph more similar in shape to that suggested in the prediction would have resulted.
I know that I have been critical about quite a few of the things I have done, not done and the equipment I have used now it is time for me to point out some improvements I would make if I re-did my experiment here are some of them:
In conclusion, the accuracy of the results was certainly good enough to make a sensible conclusion. If the experiment had been conducted under more strict conditions and with more advanced instruments, the conclusion would not have been different although the individual results might have been more accurate and the graph might have looked very slightly different.