In this experiment I will be investigating and analyzing the factors affecting the rate of decomposition of hydrogen peroxide by catalyse in immobilised yeast.
ABDULLAH QANDEEL
INTRODUCTION
In this experiment I will be investigating and analyzing the factors affecting the rate of decomposition of hydrogen peroxide by catalyse in immobilised yeast. This essentially is an enzyme practical. You know that various things alter the rate of enzyme-controlled reactions. I plan to carry out an experiment that investigates how one factor alters the following reaction:
Hydrogen peroxide (2H2O2) Catalyse Enzyme Water (2H2O) + Oxygen (O2)
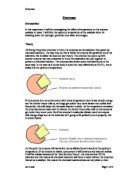
Enzymes are biological catalysts that speed up reactions in living organisms. Without them reactions would be too slow for organisms to survive. Hydrogen peroxide is a waste product formed in cells. Since it is a highly poisonous (a powerful oxidising agent), it must be broken down as quickly as possible. Catalyse is an enzyme found in all cells that breaks down hydrogen peroxide to water and oxygen (harmless products). It is a very fast enzyme (the fastest known today)
As catalyse is found in yeast, a solution of active yeast provides a convenient source of the enzyme. I am going to first immobilise the yeast as it is much better to work with fixed quantities of the enzyme (catalyse) that does not get mixed up with reactants and products. The substrate reaches the enzyme by diffusion in the normal way, as the immobilising framework is porous.
Enzymes such as catalyse are protein molecules, which are found in living cells. They are used to speed up specific reactions in the cells; these reactions are all very specific as each enzyme just performs one particular reaction. Catalyse is found in food such as potato and liver. It is able to speed up the decomposition of Hydrogen Peroxide because of the shape of the Hydrogen Peroxide molecule. This type of reaction where a molecule is broken down into smaller pieces is called an anabolic reaction. Enzymes are able to increase the rate of reaction without actually being consumed in the process. This means, enzymes are very efficient. Small quantities at low temperatures are able to produce results, as they don't run out of usage, which would require high temperatures and a violent reaction from any normal chemical means. Although increases in temperature may speed up the reaction, enzymes are unstable when heated. When this happens to enzymes such as catalyse they are said to e denatured. Within doing this experiment there is a choice I had to make before I do the preliminary work. As there are several factors affecting the rate of decomposition of hydrogen peroxide, I only needed to investigate and experiment one. Some the factors that affect enzyme activity are:
* Enzyme concentration: must maintain this by keeping bead size the same
* Substrate concentration: varies the rate of reaction
* Temperature: varies rate of reaction due to more collision
* ·PH: shape of active site
For my preliminary work I chose to do temperature. This is because temperature can be explained scientifically in a much more complex manor this would help me gain more marks in this experiment as there is more to talk about. When you can describe something in more detail, you can make it out to be better. I was aiming to test out what it would be like to do temperature. I basically had to see which would be my independent variable.
Preliminary Work
As I chose to do my preliminary work on the factor of temperature, I tried to make the most of it, as it would be good experience before the real experiment. I used the same experiment I am going to use to find the effect of temperature on enzymes. The experiment I did of my preliminary work was a shortened version of the real experiment as I only did three different temperatures.
Results Of preliminary work:
0ºC
40ºC
70ºC
02:08
0.18.27
03:42
02:19
0.18.07
03:52
02:20
0.18.21
03:40
Investigation
After my preliminary experiment, I got a flavour of what I am doing and what I intend to do for my actual practical. The results showed me that as the temperature goes higher the rate at which catalase works at increases, until the enzyme cannot work anymore. At this stage it is said to be denatured. When the enzyme is denatured we expect it not to work at all. This might seem odd as it did work at 70ºC. Well there is an explanation to that. It could have been because the hydrogen peroxide was reaction with impurities within the test tube and caused bubbles to push the bead up. Alternatively it could have been because the beads were penetrated through by the vigorously hot water and formed a bubble, which made it go up. Surly and very definitely, catalase does not work at 70ºC. In general my results reflect my overall theory of this experiment. That is that as the temperature goes up, the rate at which catalase works at increases until it reaches its optimum where it will denature and not function. I decided to do the temperature factor. The temperature will be my independent variable.
Prediction
My prediction is supported by Kinetic Theory in that if I apply twice as much heat there will be twice as much particle vibration therefore the reaction will happen twice as quickly. Collision Theory also backs it in that if I apply twice as much heat there will be twice as many collisions and therefore the rate of reaction will double. This means that the bead will rise in half the time. This will only be so until the enzyme denatures after its optimum temperature: 40 - 45°C. I predict that the enzyme will become denatured, and therefore will work at a slower rate after 40 - 45°C. I think the reason for this prediction is because every enzyme has a temperature range of optimum activity. Outside that temperature range the enzyme is rendered inactive. This occurs because as the temperature changes enough energy is supplied to break some of the molecular bonds. When these forces are disturbed and changed the active site becomes altered in its ability to accommodate the substrate molecules it was intended to catalyse. Most enzymes in a human body shut down beyond certain temperatures. This can happen if body temperature gets too low (hypothermia), or too high (hyperthermia).
From my background knowledge it is evident that as temperature increases, the rate of reaction also increases. However, the stability of the protein also decreases due to thermal degradation. Holding the enzyme at a high enough temperature for a long period of time may cook the enzyme. Reaction rate is the speed at which the reaction proceeds until reaching equilibrium. For an enzyme-catalysed reaction, the rate is usually expressed in the amount of product produced per minute. The energy barrier between reactions and products governs reaction rate. In general, energy must be added to the reactants (glucose oxygen) ...
This is a preview of the whole essay
From my background knowledge it is evident that as temperature increases, the rate of reaction also increases. However, the stability of the protein also decreases due to thermal degradation. Holding the enzyme at a high enough temperature for a long period of time may cook the enzyme. Reaction rate is the speed at which the reaction proceeds until reaching equilibrium. For an enzyme-catalysed reaction, the rate is usually expressed in the amount of product produced per minute. The energy barrier between reactions and products governs reaction rate. In general, energy must be added to the reactants (glucose oxygen) to overcome the energy barrier. This added energy is termed "activation energy", and is recovered as the reactants pass over the barrier and descend to the energy level of the products. Enzymes can accelerate the rate of a reaction. Catalysts accelerate the rates of reactions by lowering the activation energy barrier between reactants and products. All chemical reactions speed up as the temperature is raised. As the temperature increases, more of the reacting molecules have enough kinetic energy to undergo the reaction. Since enzymes are catalysts for chemical reactions, enzyme reactions also tend to go faster with increasing temperature. However, if the temperature of an enzyme catalysed reaction is raised still further, an optimum is reached: above this point the kinetic energy of the enzyme and water molecules is so great that the structure of the enzyme molecules starts to be broken away or disrupted. The positive effect of speeding up the reaction is now more than taken away by the negative effect of denaturing more and more enzyme molecules. Temperatures around 40 - 50°C, denature many proteins but some are still active at 70 - 80°C, and a few withstand being boiled. So, my first prediction is that the enzyme will become denatured at around 40°C, and secondly, that as the temperature increases the reaction rate will increase by 50%, due to the molecules colliding together at a higher speed (kinetic theory) due to their extra energy obtained by the increase in temperature. My prediction is supported by Kinetic Theory in that if I apply twice as much heat there will be twice as much particle vibration therefore the reaction will happen twice as quickly. Collision Theory also backs it in that if I apply twice as much heat there will be twice as many collisions and therefore the rate of reaction will double. This will only be so until the enzyme denatures after its optimum temperature: 45°C. In conclusion to my prediction I predict that if I increase the temperature this will increase the rate of catalyse activity because there will be more chemical reactions caused by successful collisions between the active site of the enzyme (catalyse) and the substrate (hydrogen peroxide). Until the enzyme denatures in which case there will be no more activity and the reaction (H2O2+Catalase) would not go ahead therefore there is no oxygen produces to cause the bead to rise. The prediction will help me with my method, as it will give me an idea of what to expect.
Method
The experiment I am going to do requires me to have an analytical approach in order to get sufficient evidence to support my prediction. This means that I need to have an organised approach. I am going to start off by gathering all the different pieces of apparatus. Then I am going to decide which independent variable I am going to change. I already decided to do temperature. The ranges of temperatures are the following:
* 0ºC
* 30ºC
* 40ºC
* 50ºC
* 60ºC
* 70ºC
* Room Temperature
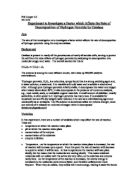
I have chosen these ranges so that I can obtain a good outlook on to the enzymes behaviour under different temperatures. Also I used these ranges so that I can obtain the most accurate results as I have precise results. They will also give me a good measure of rate as the range is all round the experiment. I started from the lowest temperature possible, until I reached the highest temperature possible, which was of 70ºC. I did not go higher because 70ºC is high enough as catalase is known to denature at about 50ºC. When actually doing the experiment, first I will form my beads using a syringe filled with 10cm3 of a mixture between yeast and alginate. The ration of the mixture is as shown on the diagram below.
I used the ratio of 7:3 because when I did my preliminary work, my beads were a little too soft and I needed to correct that aspect of the experiment. Then I will place my finished beads in a Calcium solution. After the making the beads I will place them evenly spread (number wise) to 7 test tubes full of distilled water. Then I aim to leave them within each temperature for 5 minutes to heat up or cool down to the temperature needed. The independent variable in this experiment is the temperature so everything else needs to stay stationary and the same as it is applied to every temperature. I aim to do this experiment with total accuracy. Then I will place peroxide solution of the concentration 0.3Mol dm-1 in seven different test tubes, half way up. Then I placed one test tube in to each temperature range. I chose the concentration of 0.3mol dm-1 because as a concentration it is not to high and wont be to volatile and make the reaction go really quickly. I will use a measuring cylinder to measure out all these values. We need the reaction to happen slowly so that we can time it to a good proportion. Therefore I chose the concentration. After I leave each peroxide test tube in its temperature for 5 minutes I then aim to measure the temperature of each test tube by placing a thermometer within the test tube and record it. Then I will place a bead within the peroxide solution and at the point of its collision with water, I will start the stopwatch until it touches the surface again. Time is a dependent variable and is a key aspect to the experiment. I use this system of starting the timing as soon as the bead touches the solution because it is much easier to identify and it also gives room for human error. I aim to drop the bead from a close height so that the height does not take advantage in pushing the bead down further, therefore making the run take longer. I time using seconds and I use a normal stopwatch.
Reliability
I aim to repeat timings of each bead as many times as it takes to get satisfactory or adequate results. When I say satisfactory I mean results with 10% of each other. When I obtain three consistent results then I aim to move on to the next temperature. I understood this because I though about it during my preliminary work as a way to obtain accurate readings of this whole analysis. I will also keep an eye open if anything occurs which didn't occur during my preliminary experiment, as there could be something wrong with the apparatus etc. It is extremely necessary to perform repeats. This is because it will help us to gain accurate understandings of the relationships between temperatures. The reliable a reading is the more powerful the results of an experiment are. That's why it is an important aspect to make your results reliable. I aim to ensure that my results are reliable by taking the following steps:
* Obtaining clean apparatus
* Calculating time accurately by getting a reliable stopwatch
* Concentrate on co-ordination of timing by starting time when bead touches water and stop when bead submerges.
* Measure the ACTUAL temperature within water bath etc.
* Record results (time in seconds) with two decimal places.
Apparatus
I aim to use specific pieces of apparatus. Apparatus will help me to be accurate and precise:
* 10cm3 measuring cylinder
* Hydrogen Peroxide
* Sodium Alginate
* Yeast solution
* 12 Bungs
* 6 Water baths
* 1 Stopwatch
* 1 Marker pen
* 1 scalpel
* 7 thermometers
* 14 test tubes
* 1 Syringe
* 2 measuring cylinders
Other Factors
The factors that affect enzyme activity are:
· Enzyme concentration (Maintained the same)
· Substrate concentration (Maintained the same)
· Temperature (The independent variable)
· PH (Maintained the same)
I aim to keep all of the variables, which are to stay the same the same. I am going to do this by accurately measuring amounts of substances to equal amounts. I aim to change the temperature, as it is my independent variable. I aim to do this using simulated temperature available for me using water baths. There are many other factors, which can affect the rte at which catalase works at. These range from the following:
* Light (which pigment of light) green, red or blue
* Surface area, should be the same all depends on beads
* Size of beads and ration it is made at
* Wind, no wind in classroom
* Room temperature, will be kept the same
I aim to keep the other factors the same, as they are potential candidates to ruin the accuracy of the experiment. I will keep things such as enzyme concentration and pH levels the same. I will obtain water that is distilled and the enzyme concentration shall always be the same. Enzyme concentration is kept the same because the catalase is in immobilised yeast, which contains the same amount of catalase in each bead as in any other bead.
Control
I will repeat the test at each value as many times as possible until I reach minimum of three values within 10% of each other then take an average to make it a fair test. More importantly I will also keep the temperature of the room the same throughout the experiment using the thermostatic controls in the laboratory. The temperature will remain at 20ºC.
Safety
While carrying out this investigation I had to follow these safety rules. Always wear safety goggles to protect the eyes from the
Hydrogen peroxide. Keep all apparatus away from the edge of the desk to prevent breakages. Do not run around or rush about.
Temp
0ºC
30ºC
40ºC
50ºC
60ºC
70ºC
ROOM
Actual
Temp
5ºC
33ºC
42ºC
48ºC
62ºC
69ºC
23ºC
st
Trial
(s)
32s
(2:12)
24.37
7.74
4.08
8.32
3.12
29.68
2n
Trial
(s)
39s
(2:19)
24.27
8.00
21.01
7.19
3.00
23.65
3rd
Trial
35s
(2:15)
24.17
7.52
25.68
7.65
3.31
24.34
4th
Trial
(s)
22.62
25.68
5th
Trial
(s)
24.57
25.68
6th
Trial
(s)
22.46
25.49
7th
Trial
(s)
23.01
28.79
8 th
Trial
(s)
7.44
29.17
9th
Trial
(s)
5.84
22.11
0th
Trial
(s)
7.01
29.30
1th
Trial
(s)
5.68
32.0
2th
Trial
(s)
9.10
3th
Trial
(s)
7.65
4th
Trial
(s)
4.22
5th
Trial
(s)
5.54
6th
Trial
(s)
6.10
The results table contains all of the results I obtained after performing the experiment. The table contains temperatures I aimed at doing and the actual temperature below it. On the left hand columns is the number of times it took me to repeat before obtaining three results of each temperature within 10% of each other. On some temperatures this took a long time. I marked the temperatures within 10% of each other by their colour, white. The three figures in white are the three I selected to go to the averages table. The other figures in black are other results I obtained which were too far from the range I was looking for. On 60ºC and 70ºC I believe that they are anomalies as the results are inconsistent and do not co-operate with the rest of the experiment. The anomalous results are the results coloured in orange. I decided not to put them on the final graph as I conclude for the enzymes to be denatured at that temperature, therefore behaving. A further explanation on denaturing will be later on this coursework. The second table, which is after this paragraph, is a table of averages from the results coloured in white. These averages will be put together then divided by three (the number of results). This should give me an average for each temperature. Then I divided 1 by the average in order to obtain the figures for the graph, which will reflect the rate of the whole experiment. I recorded actual temperature to be more concise as temperature is a variable, which often changes and could jeopardise the accuracy of the experiment. I measured the time to 2Decimal Places, which is realistic and sufficiently accurate in order to obtain a good average.
Averages Table
From the results above I produced a graph, which reflects the temperature at which catalase works at best and has the highest rate at. The graph is by hand. The graph in general came out as I predicted. That any range after 40-45ºC would be an anomaly as the enzyme would be denatured. The sketch below is a detailed explanation of the graph, had the enzymes not denatured the graph would have been as it looks in the dotted line:
Optimum rate of reaction
Conclusion Based On Scientific Knowledge
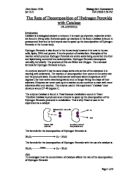
As you can see from the above table of averages, I excluded temperatures 60ºC & 70ºC. This is because the enzyme is denatured at that temperature. Had the enzymes not denatured the rate would have gone down anyway as shown on the sketch. An enzyme's tertiary shape is held together by hydrogen bonds, which cause it to be fixed in a certain shape. When there is a change in the normal conditions of an enzyme, the hydrogen bonds are broken and therefore the shape of the enzyme is changed. At the same time, the active site in the enzyme looses its shape and so the enzyme cannot react with its substrate. The way the enzyme would have reacted normally would be explained by the lock and key mechanism, which is illustrated below.
The lock and key mechanism states that the substrate must be able to fit into the enzyme for the reaction to take place. Once the substrate has been fitted into the enzyme, the reaction takes place, and the products of the reaction have been formed. Here is the word equation for the lock and key mechanism in this case: -
Hydrogen peroxide + enzyme › E-S (enzyme › water + oxygen
Substrate complex) + enzyme
Predictions
The results I obtained from the experiment. All of the results used in the averages table for each temperature were within 10% of each other. I managed to follow this by redoing the bead dropping process again and again. My conclusion from the graph is that my predictions support my prediction which had much to do with several theories and that mainly the reaction between Hydrogen Peroxide and Catalase (immobilised) stopped at about 44ºC as I predicted due to the denaturing process which is explained previously. There were some weaknesses from the experiment, which made it more difficult to support my prediction after all. I saw that if I left the beads in the selected temperature, the beads will start to expand then rise, this could cause inaccuracy. Throughout most of the range I thought the results were appropriate until I got to 60ºC and 70ºC, which were too high and caused the enzyme to denature.
Trends & Patterns
My graph shows that at the lower temperatures, the rate of reaction rises with a very steep gradient as the temperature increases (0-36°C). This is because the molecules of the enzyme move faster and faster thus causing the rate of enzyme-substrate collisions to increase. We know that the rate of reaction doubles every 10°C. This can be shown by:
Q10 = 2
The temperature rises to such a degree that the enzyme becomes denatured. This is because the molecules of the enzyme vibrate so violently that they break their weak bonds holding the structure of the enzyme together. As shown in the graph, the perfect temperature for the majority of enzymes is between 37-45ºC. For this reason, our body temperature is 37°C
Starting to look at this graph I can clearly see that with the line of best fit drawn is following the trend of my prediction. The graph shows a strong relationship. It is a positive correlation because as the temperature goes up, so does the rate. My graph looks promising as it follows my prediction, some of the results could be wrong, however I can still pull some conclusions from this and one is that we can definitely see that with a higher temperature the more oxygen we are producing.
The optimum rate is when we produced the most oxygen this is because there are more reactions taking place and more collision and so there was a higher percentage of reactions causing a higher work rate. This is largely scientifically explained above using Q10. The tail off at the end represented by the doted lines is whet is should have been like if the enzymes had not denatured at 60ºC and 70ºC.
Evaluation
In my investigation I was pleased with my achievements.
In my method, keeping the temperature constant throughout the investigation was hard to maintain, as the temperature of the contents of the tube would change quite quickly and therefore the hydrogen peroxide wouldn't be at the temperature required. To overcome this problem I could keep the test tubes in a hot water bath for all the temperatures making sure that the water bath was the suitable depth. This would ensure constant temperature throughout the whole 5 minutes.
My results are in line with those I predicted. Graphs indicate rise in temperature up a point leads to an increase in oxygen production. This is in line with kinetic theory. However it is very clear that after a certain temperature is reached the enzyme actually virtually stops. This supports my theory of lock and key fit. However optimum activity of enzyme is at about 37ºC this is as we expected. But at 42ºC the enzyme is still not denatured according to my results. This is a higher temperature than I would expect. Possible not allowing solutions to reach temperatures selected has led to an inaccuracy. It may be that in fact that many temperatures of solutions were lower than I stated. Overall, due to reliable repeats and in general predictions being confirmed I feel my results are reliable enough to make a conclusion. The obvious thing I would improve about the measurements I made would be to increase the range of temperatures used. Especially between 55ºC-100ºC. In this way it may be clearer at the temperature which denaturing took place, and would possibly give a graph that resembled the graph in background knowledge this would also give us a good spread. Also the experiment could be improved by bringing in results in to a closer percentage. Another way of improving this investigation is to change the method. The data that I collected was reasonable for the accuracy of my experiment, it was fairly reliable meaning that the results we collected were mostly expected but again with human error and contamination there were a few different results, which stood out quite a lot. But by adding the line of best fit everything came together and some basic conclusion were produced but also the results were just accurate enough to back up my prediction quite substantially. A major cause for concern on accuracy was the reading of the overall measurement of the oxygen produced as we measured it by using immobilised beads and observing them until they reached the top. There is substantial room for human and common error. I think the timing was as accurate and reliable as it could be, but only a second or third experiment would back that up fully. The equipment we used was reasonable but not the best, but for the conditions we were based in it was the best we were going to get, I think contamination was minor so that did not cause a problem. One problem with our preliminary experiments was that when we came to making the beads, the sodium alginate solution was contaminated with other substances including yeast, which could have affected my main experiment substantially. Otherwise the general quality of all other substances used within the experiment was very adequate.