Investigation to find the effect of different concentrations of sugar solutions on osmosis.
Investigation to find the effect of different concentrations of sugar solutions on osmosis
NOTE all writing in red gives you hints
Prediction
Osmosis is defined as 'the movement of water molecules from an area of high water concentration to an area of low water concentration, across a semi-permeable membrane' (Collins, 1999).
If you get information from books put the copied text in brackets and at the end put the authors surname and date the book was published in brackets. Then put the full details of the book at the end of the course work in the 'References'
In a high concentration of water the amount of solute (e.g. sugar) is low. This could be called a weak or dilute solution.
In a low concentration of water the amount of solute (e.g. sugar) is high. This could be called a strong or concentrated solution.
When two such solutions are divided by a semi-permeable membrane the water will move from the area of high concentration to the area of low concentration, until both sides are equal (have reached equilibrium).
This can be seen in living cells. The cell membrane in cells is semi-permeable and the vacuole contains a sugar/salt solution. So when a cell is placed in distilled water (high water concentration) water will move across the semi-permeable membrane into the cell (lower water concentration) by osmosis, making the cell swell. This cell is now referred to as turgid. If done with potato cells the cells would increase in length volume and mass because of the extra water.
If these potato cells were placed in a solution with a low water concentration, then the opposite would happen. Water would move out of the cell into the solution. In extreme cases the cell membrane breaks away from the cell wall and the cell is referred to as plasmolysed. The potato cells will have decreased in length, volume and mass.
The greater the concentration of water in the external solution the greater the amount of water that enters the cell by osmosis. The smaller the concentration of water in the external solution the greater the amount of ...
This is a preview of the whole essay
If these potato cells were placed in a solution with a low water concentration, then the opposite would happen. Water would move out of the cell into the solution. In extreme cases the cell membrane breaks away from the cell wall and the cell is referred to as plasmolysed. The potato cells will have decreased in length, volume and mass.
The greater the concentration of water in the external solution the greater the amount of water that enters the cell by osmosis. The smaller the concentration of water in the external solution the greater the amount of water that leaves the cell.
However, there will be a point where the concentrations of water inside and outside the potato cells are equal (isotonic). At this point there will be no change in the length, volume and mass of the potato, as the net movement of water will be zero, no osmosis has occurred.
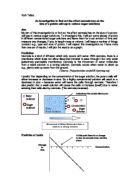
Using this information a graph and prediction can be made
At point A the graph suggests that no osmosis has occurred, suggesting that the concentration of water inside the cell is equal to the solution outside.
At point B (high water concentration), there is no indication that the cell is increasing further in size. This is because the cell is fully turgid and no more water can enter.
At point C (low water concentrations), there is no indication that the cell is decreasing further in size. This is because the cell is fully plasmolysed and no more water can leave the cell.
When making a prediction, you must say what you think will happen and why. It is also very important to have a numerical guess which can be tested in the analysis e.g. when you double the concentration the rate will double.
Method
Apparatus: 1 Molar sugar solution, distilled water, potato, cork borer, mass balance, boiling tubes, knife, labels, measuring cylinder
Plan: A range of sugar solutions will be prepared with concentrations from 0.2 M to 1.0, in intervals of 0.2, by adding varying amounts of distilled water. Sections of potato will be cut using a cork borer and knife to equal lengths, this will keep the surface area constant and their mass measured. 10 ml of each concentration of sugar will be placed in three test tubes and labeled. To each test tube a cut piece of potato will be added and its mass added to the label. These will be left for 24 hours. Then the potato pieces will be removed, the surface solution removed using paper towels and weighed. Three readings are taken for each concentration in order to get an average and reduce the effect of anomalous results. As it is difficult to get the cut potato pieces to the same mass it was decided that a percentage change in mass will be used to compare the data in the results, as this would be far more accurate.
Preliminary work suggested that the concentrations, time the potatoes were left for and measuring percentage change were appropriate and that reasonable results could be obtained.
Table to show how concentrations were mixed
Volume of distilled water (cm3)
Volume of 1Molar sugar solution (cm3)
Concentration of sugar solution (M)
0
0
0.0
8
2
0.2
6
4
0.4
4
6
0.6
2
8
0.8
0
0
.0
Results
Concentration of sugar solution (M)
Test tube
Initial mass of potato (g)
Final mass of potato (g)
Percentage change in mass
0.0
.28
.54
20.31
2
.30
.59
22.31
3
.54
.54
0
0.2
.33
.26
-5.26
2
.33
.28
-3.76
3
.57
.30
-17.20
0.4
.30
.03
-20.77
2
.34
.01
-24.63
3
.57
.05
-33.12
0.6
.36
.01
-25.74
2
.34
.00
-25.37
3
.58
.04
-34.18
0.8
.35
.02
-24.44
2
.32
.00
-24.24
3
.55
0.98
-36.77
.0
.30
.02
-21.54
2
.31
.03
-21.37
3
.55
.04
-32.90
These results can be changed slightly by adding or subtracting 0.01 - 0.05 from the initial and final mass readings, but remember to recalculate the % change and average.
Concentration of Sugar solution (M)
Average percentage change in mass
0.0
4.21
0.2
-8.74
0.4
-26.17
0.6
-28.43
0.8
-28.48
.0
-25.27
GRAPH OF YOUR RESULTS GO HERE
Conclusion
The prediction made is supported by the evidence obtained from this investigation. It shows that the potato cells increase mass in solutions with a high water concentration and decrease in mass in solutions with a low water concentration. At concentrations above 0.6 M, there appears to be no further water loss, suggesting that the cell is fully plasmolysed.
From the graph an estimate to the concentration of the potato cell can be made as 0.132 M. As this is the point where the potato is not increasing or decreasing in mass. However, it is important to realize that this is only an estimate as the potato cells will not be uniform in their concentration.
Evaluation
The graph obtained in the results has a strong resemblance to the one in the prediction. This suggests that the experiment was fairly accurate.
The accuracy of the investigation was adequate, however the concentrations were measured using a measuring cylinder and could be made more accurate using titration. Also when the potato was dried to remove surface liquid it was not necessarily done the same on each potato, a more accurate and uniform way of drying would improve the accuracy further.
Although 3 repetitions of each concentration are sufficient, there was a possible anomalous result (circled on graph). This part of the investigation would need to be repeated.
Further work could be carried out to include concentrations that increased in 0.1 M rather than 0.2. This would increase the accuracy and improve the graph. Other investigations could include using different varieties of potato or different plant tissues e.g. carrot.
References
Collins, 1999 'The Biological Dictionary'
This is where you put the titles of books you have used or copied information from.
If you still can't find any of the coursework that you are looking for, click here to look at over 12,000 GCSE, A-Level and University Level essays on Coursework.Info.