The effect of concentration of sucrose solution on the osmosis in potato
The effect of concentration of sucrose solution on the osmosis in potato
Year 10 Biology IA
0/12/2010
Amanda Hsieh
TABLE OF CONTENTS page number
DESIGN
1.1 Defining the problem 2-3
* Focus / research question
* Hypothesis
* Background information / theory
* Investigation Variables
1.2 Controlling Variables 4
* Treatment of Controlled Variables
* Control Experiment
1.3 Experimental Method 4-5
* Materials
* Risk Assessment
* Method
2 DATA COLLECTION and PROCESSING *
2.1 Recording Raw Data 6-7
* Quantitative Data
* Qualitative Data
2.2 Processing Raw Data 7
* Statistical Processing - calculations
2.3 Presenting Processed Data 7-9
* Result (s) table (s)
* Graph (s)
3 CONCLUSION and EVALUATION *
3.1 Conclusion 9-10
* Conclusion statement
* Conclusion explanation
3.2 Evaluation Procedures 10-11
* Reliability
* Limitations / Weaknesses / errors in Laboratory Investigation
* Significance of weaknesses on experimental results
3.3 Improving the Investigation 11
* Modifications to experiment
BIBLIOGRAPHY
* APPENDIX I: Equipments used in the osmosis experiment 12-13
* APPENDIX II: Diagrams of the osmosis experiment with different 14-15
concentration of sucrose solution
* APPENDIX III: Osmosis Journal 16
* APPENDIC IV: Risk Assesment & Equipment Order Form 17
DESIGN
.1 Defining the problem
Focus / Research question
How does the concentration of sucrose solution affect on the osmosis in potato cells?
Hypothesis
For low concentration of sucrose, the potato will increase in mass. As the concentration of sucrose is increase, the increase of mass will be less. This is because water will move through a semi- permeable cell membrane from a low to a high concentration solution. For higher concentration of sucrose the reverse will occur and the mass of potato will decrease.
Background Information / theory
Diffusion is the random movement of molecules from a region of high concentration to a region of low concentration. Small non-polar molecules such as oxygen and carbon dioxide can cross through a plasma membrane to the region of low concentration. Most of polar molecules can't cross the lipid membrane freely, as they are too big to cross the membrane, like sugars and proteins. Whereas, water molecules are polar, but they can pass through the membrane freely, since they are small enough. This case of diffusion involves the movement of water molecules crossing the membrane called osmosis. (Factors Affecting the Rate of Osmosis, 2010)
"Osmosis is the passage of water from a region of high water concentration through a semi-permeable membrane to a region of low water concentration." (How osmosis works, 2010) Semi-permeable membranes are very thin layers of material that selected which molecules can pass through the membrane.
There have three types of solution, isotonic, hypertonic and hypotonic. If the osmotic concentrations of two solutions are equal, the solutions are isotonic. However, when the solutions have unequal osmotic concentrations, the solution with the higher concentration of solutes is hypertonic and the solution with the lower concentration of solutes is hypotonic.
If a potato cell is placed in a hypotonic solution of sucrose, water will defuse in to the potato cell. This will cause the potato cell to increase in size and gain mass. This process will stop when the rigid cell wall will not allow the cell to increase in size any further. The process will also stop if the potato cell became isotonic with the surrounding solution. If a potato cell is placed in a hypertonic solution of sucrose, water will defuse out of the potato cell. This will cause the potato cell to decrease in size and loose mass. This process will continue until either the potato is isotonic with the surrounding solution or else the potato died.
Investigation variables
(How osmosis works, 2010)
TABLE 1: Practical Investigation Variables
Type of variable
Identified Variable
Independent
Concentration of the sucrose solution in the surrounding solution (0%, 5%, 10%, 15 % and 20%)
Dependent
Mass of 2 cm potato cylinder
Controlled
* size of potato
* size of container
* temperature (room temperature)
* volume of solutions (with difference concentration)
* length of investigation time for each Petri dish
* shape of the potato ( cylinder)
Uncontrolled
...
This is a preview of the whole essay
Investigation variables
(How osmosis works, 2010)
TABLE 1: Practical Investigation Variables
Type of variable
Identified Variable
Independent
Concentration of the sucrose solution in the surrounding solution (0%, 5%, 10%, 15 % and 20%)
Dependent
Mass of 2 cm potato cylinder
Controlled
* size of potato
* size of container
* temperature (room temperature)
* volume of solutions (with difference concentration)
* length of investigation time for each Petri dish
* shape of the potato ( cylinder)
Uncontrolled
* Quality of the potato
* Weather (affect room temperature)
.2 Controlling Variables
Treatment of controlled variables
TABLE 2: Control Treatment of Variables
Variables
Control treatment
* size of potato
Use a cork borer to make the potato in to the shape of cylinder and use a scalpel to cut the cylinder into 2cm lengths.
* size of container
Use same shape and size of test tube to place the potato cylinder with different concentration of sucrose solutions.
* temperature (room temperature)
Carry out the experiment in the laboratory under the same conditions.
* volume of solutions (with difference concentration)
Add 20 cm3 of 0%, 5%, 10%, 15% and 20% sucrose solution in each test tube. Each of the condition will be repeated five times.
* length of investigation time for each test tube
Each investigation will be carrying out for 24 hours.
* shape of the potato ( cylinder)
Use the borer to cut the potato cylinder and then measure 5cm3 of potato cylinder with the ruler. Try to make the mass and length as even as possible.
Control Experiment
The control experiment will be carrying out distilled water used in place of the sucrose solution.
.3 Experimental Method
Materials
Apparatus Required
Quantity
* Cutting tile
* Scalpel
* 30 cm3Test tube
25
* Different concentration of sucrose solution (0%, 5%, 10%, 15% and 20%)
50
* Potatoes
2
* Tissue paper
5
* Electronic Weighing scales
* Cork borer
1
* Ruler
* 20 cm3 measuring cylinder
* Test tube holder
2
* Tweezers
Practical Safety and Risk Assessment
Refer to Appendix IV - QAHS STUDENT ACTVITY RISK ASSESSMENT and PRAC ORDER FORM
Method
* Cut out 5 pieces from the same potato using a borer and cut the pieces into 2 cm length to give potato pieces around 1 cm3.
* Cut the potato with more accuracy using a ruler making and electronic weighting balance to make sure that all the potatoes are as equal as possible in length and weight.
* Place 1 piece of potato in each of 25 test tubes
* Place each of the test tubes on to the test tube holder
* Add 20cm3 sucrose solution into each test tube. (5 test tubes for each concentration of sucrose solution)
* Leave the potatoes in the solution for a total of 24 hours.
* Wipe the potatoes with tissue paper so there is no liquid on them and then weigh them and record the mass.
* Average the masses of the potato for each of the sucrose concentrations
* Calculate the total mass change of each potato. (mass at time = t - mass at time = 0)
* Graph the change in mass of the potato verses sucros concentration
Diagram 1: Experimental Setup
* See Appendix I: Equipments used in the osmosis experiment
2 DATA COLLECTION and PROCESSING
Photograph or Diagram of Lab Setup
Diagram 1: The experimen setup of the osmosis experiment.
This shows how the experiment should be set up. The 150cm3 test tube must be place carefully in the test tube holder. Each row contains 5 trials of different % of sucrose solution.
2.1 Recording Raw Data
Quantitative Raw Data
Table 3: The changing mass of potato with different % of sucrose solution
% of Sucrose solution
5% Sucrose solution
0% Sucrose solution
5% Sucrose solution
20% Sucrose solution
Water (0% sucrose solution)
Before
After
Before
After
Before
After
Before
After
Before
After
Mass of potato
Mass (g) + 0.001
Mass (g) + 0.001
Mass (g) + 0.001
Mass (g) + 0.001
Mass (g) + 0.001
Mass (g) + 0.001
Mass (g) + 0.001
Mass (g) + 0.001
Mass (g) + 0.001
Mass (g) + 0.001
Trial 1
.053
.102
0.985
0.814
.128
0.841
0.967
0.742
.101
.116
Trial 2
.118
.103
.141
.094
.041
0.625
.051
0.823
.143
.222
Trial 3
.084
.081
.107
.061
.103
0.779
.077
0.810
.038
.264
Trial 4
.138
.127
.132
0.965
.078
0.773
.070
0.778
.084
.294
Trial 5
.089
.142
.048
.020
.074
0.845
.051
0.789
.079
.264
Qualitative Raw Data
See Appendix II: Diagram of the osmosis experiment with different concentration of sucrose solution
2.2 Processing Raw Data
Statistical Processing - calculations
Statistical Analysis
Formulae
Sample Calculation
Average
0.049+(-0.015)+(-0.003)+(-0.011)+(0.053)
5
= 0.015 (Average changing mass)
*Using the results of changing mass in 5 % sucrose
Standard Deviation
* Lower case sigma means 'standard deviation'.
* Capital sigma means 'the sum of'.
* x bar means 'the mean'
= deviation from mean
Changing mass of potato cylinder
Initial mass of potato cylinder - Final mass of potato cylinder = Changing mass of the potato cylinder
Initial mass
Final mass
.053
.102
.053-1.102= 0.049 (Changing mass)
* Using the result of 5% Trial 1 as an example
2.3 Presenting Processed Data
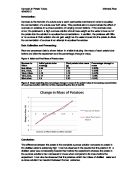
It was decided to process and present the results of the experiment in the form of quantitative table and a scatter graph. Since the dependent variable of the experiment was testing on the mass change of the potato cylinder, the form (shape) of scatter the graph can used to show the relationship between the concentration of sucrose solution and the change in mass of potato cells.
Results Table
Table 5: The Changing mass of potato with different % of sucrose solution
% of sucrose solution
5% Sucrose solution
0% Sucrose solution
5% Sucrose solution
20% Sucrose solution
Water
Trial
Change in Mass (g) + 0.002
Change in Mass (g) + 0.002
Change in Mass (g) + 0.002
Change in Mass (g) + 0.002
Change in Mass (g) + 0.002
Trial 1
0.049
-0.171
-0.287
-0.225
0.015
Trial 2
-0.015
-0.047
-0.416
-0.228
0.079
Trial 3
-0.003
-0.046
-0.324
-0.267
0.226
Trial 4
-0.011
-0.167
-0.305
-0.292
0.210
Trial 5
0.053
-0.028
-0.229
-0.262
0.185
Average
0.015
-0.092
-0.312
-0.255
0.143
STDV
0.034
0.071
0.068
0.028
0.092
Results Graph(s)
3 CONCLUSION and EVALUATION
3.1 Conclusion
Conclusion Statement
The results strongly supported the hypothesis, which suggests the mass of potato will increase when the concentration of sucrose solution is lower. Additionally the experiment confirms the osmosis theory, that water molecules will move from the higher water concentration of solution to the lower water concentration of solution.
Conclusion Explanation
In this experiment, mathematical calculation has been used to calculate the mass change of potato in different concentrations of sucrose solution, the average of change in mass and the Standard deviation. Therefore the affect of concentration of sucrose solution can be seen easily and clearly.
However, some random error has occurred in the results of 15% sucrose solution, as the mass of potato has decreased too much. The result of 15% sucrose solution has been excluding from Graph 2 to indicate the affect of random result to the relationship between the concentration of sucrose solution and the potato. Since the results are too random and abnormal change in mass Table 5). The result will be more close to the osmosis theory and the correlation relationship will be more accurate.
It is possible that not the concentration of sucrose solution is higher than it should be and so the water molecules have been transport more quickly to the sucrose solution. In addition, the remaining liquid from previous solution may also affect the concentration of 15 % sucrose solution. If the concentration of sucrose solution is higher than expected, then the mass will decrease more.
Refer to Graph 1, the r2 value is a little bit low. If the r2 value is around 1.0~ 0.9, then the linear equation will be mostly suitable for each result. Graph 1 suggests that there is no certain equation can be used to calculate the mass change of potato in different concentration of sucrose solutions. Compare to Graph 2, the r2 value has increase to 0.9, it suggest that there is a regulate pattern for the relationship between the concentration of sucrose solution and the mass of potato.
The Standard deviations in this experiment are all small, less than 1.0, then the results of the experiment is quite reliable and accurate, since the higher the Standard deviation the less reliable the results are.
As the Standard deviation of 15% sucrose solution is only 0.67, it assume there may have some random error occur in the concentration of sucrose solution. Additionally, some systematic error or human error occurred when using the measuring equipments.
3.2 Evaluating Procedures
Reliability
The measurements have been repeated five times for each % of sucrose solution. The results have support each other, except the results of 5% sucrose solution. In the results of 5% sucrose solution, Trial 1, 3 and 5 have slightly increase in mass, but Trial 2 and 4 has decrease in mass. Thus, there may have some systematic error during the measuring process.
The standard deviation in the experiment is not large enough to cause a significant effect to the results. However, the standard deviation could have arisen if the experiment has not been carry out in a suitable method or the process of the experiment has not been follow correctly. The graph has been drawing off best fit when the result of 15% sucrose solution has been excluded. The graph has matched the predicted and support the hypothesis, the correlation relationship has been shown in Graph 2. It shows that when the % off sucrose solution increase, the potato mass will decrease.
Limitations / Weaknesses / errors in laboratory investigations
The limitation in the experiment is the source of potato. There has only two potatoes used to cut 25 pieces of 2 cm potato cylinder using the cork borer. The use of potato must been careful, too many failure potato cylinder will increase the time of experiment and the time of the other potato exposed to air will be longer. Longer the time the potato exposed to air, lighter the mass of potato cylinder, as the water of potato cylinder will lose into the air.
The weakness of the experiment is the human error, when measuring the volume of the sucrose solution; the beaker must be placed at the same high of human eyes. But slightly human error still occurred during the experiment.
There has random error occur, since the mass of potato cylinder in 15% sucrose solution decrease more than 20% sucrose solution and did not fit in the line of the correlation relationship. Some possible reasons for the error are the unclean beaker has been used to measure the 15% sucrose solution or the concentration of sucrose solution is not correct.
Systematic error has arisen during the measuring process of potato cylinder in 5% sucrose solution; the results did not support each other. Some have decrease in mass and others have increase in mass. There may be some error when using the electronic balance, e.g. the cover has not been placed on during the measurement.
3.3 Improving the Investigations
Table 6: Suggestions for Improvement
Limitation identified
Type of resultant error
(ie. Random or systematic)
Suggested method of improvement
Mass of potato cylinder in 15% sucrose solution
Radom error
Follow the procedure carefully, wash the measuring beaker every time before using.
Measuring of potato cylinder in 5% sucrose solution
Systematic error
Repeat the measurement several times and remember to cover the electronic balance during the measuring.
Measurement of volume of sucrose solution
Human error
Place the beaker at eye level and try to reduce the human error as less as possible .
Reference
o McGraw-Hill Higher Education,2006, How osmosis works, The McGraw-Hill Companies, viewed 08 October 2010 <http://highered.mcgraw-hill.com/sites/0072495855/student_view0/chapter2/animation__how_osmosis_works.html >
o Factors Affecting the Rate of Osmosis, 123HelpMe.com, viewed 08 October 2010
<http://www.123helpme.com/view.asp?id=148604 >
APPENDIX I
Equipments used in the osmosis experiment
Diagram 7: The distillised water used in the exeriment to wash out the remain liquids in the 150 cm3 test tube
Diagram 8: The scalp used to cut the potato cylinder in to 2 cm pieces.
Diagram 9: The 25 cm3 measuring cylinder is used to measure 25cm3 of sucorse solution and pure into the 150cm3 test tubes. The ruler is used to make sure each potato cylinder cube has the same length, which is 2 cm.
Diagram 10: The tweezers used to place the 2 cm potato cylinder cube into the 150 cm3 test tube and also used to take out the 2 cm potato cylinder out of the 150 cm3 test tube.
Diagram 11: The electronis balance used to measure each 2 cm potato cylinder cube's mass before and after the 24 hours of experimenting time.
Diagram 12: The different % of sucrose solution used in the experiment. There are 5 % , 10 %, 15 % and 20 % of sucrose solutions been use, the control trials used the 0% of sucrose solution, which is the water.
APPENDIX II
Diagrams of the osmosis experiment with different concentration of sucrose solution
Diagram 2: The 2 cm potato cylinder cube with 25 cm3 of 5 % of sucrose solution.
Diagram 3: The 2 cm potato cylinder cube with 25 cm3 of 10 % of sucrose solution.
Diagram 4: The 2 cm potato cylinder cube with 25 cm3 of 15 % of sucrose solution.
Diagram 5: The 2 cm potato cylinder cube with 25 cm3 of 20 % of sucrose solution.
Diagram 6: The 2 cm potato cylinder cube with 25 cm3 of 0 % of sucrose solution (water).
APPENDIX III
Biology Journal
3/09/2010
* We got the task sheet from the teacher
6/09/2010
* Read through the task sheet
04/10/2010
* The teacher explain what the is about assignment
08/10/2010
* Starting report
* Figuring out what to do
* Read article online
09/10/2010
* Found topic (Sucrose solution)
* Hypothesis: For low concentration of sucrose, the potato will increase in mass. As the concentration of sucrose is increase, the increase of mass will be less.
6/10/2010
* Writing up risk assessment and design
8/10/2010
* Hand in the risk assessment and design
9/10/2010
* Got our risk assessment back and fix up the mistakes before carrying up the experiment
25/10/2010
* Started my experiment on sucrose solution, cutting the potato cylinder in to the length and shape I need and pour different concentration of sucrose solution into each test tubes
26/10/2010
* Record the results of my experiment, the changing mass of the potato into different concentration of sucrose solution
29/10/2010
* Writing up the recording raw data, processing raw data
30/10/2010
* Writing up the presenting data, conclusion and evaluation
02/11/2010
* Hand in my Biology IA to the teacher
Year 10 Biology Osmosis of potato Amanda Hsieh
6
[Type text] [Type text] [Type text]