Examine both of the urban land use models for Hoyt and Burgess, and then the town of High Wycombe.
GCSE Geography Coursework
Major Project 2004
Candidate Name: Omar Hussain
Candidate Number:
Centre Name: Royal Grammar School, High Wycombe
Centre Number: 52423
Introduction
Aim
The aim of this investigation is to first examine both of the urban land use models that have been chosen, which are the Hoyt and Burgess land use models, and then the town of High Wycombe. This is so I can see to which extent it fits either of the urban land use models if one at all.
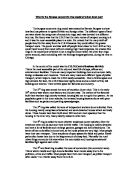
I will first begin with the Burgess model; in 1925, E.W. Burgess presented an urban land use model, which divided cities in a set of concentric circles expanding from the downtown to the suburbs. This representation was built from Burgess's observations of a number of American cities, notably Chicago. It must be taken into account while doing this model that his observations were made from a much larger, more densely populated, spacious area, than High Wycombe. So this could affect the way in which it applies to a small town.
Above: The Burgess Urban Land Use Model
It divided cities into a set of concentric circles expanding from the downtown to the suburbs. This representation was built from Burgess' observations of a number of American cities, for which he provided empirical evidence. The model assumes a relationship between the socio-economic status (mainly income) of households and the distance from the CBD. The further from the CBD, the better the quality of housing, however the longer the commuting time. Thus, accessing better housing is done at the expense of longer commuting times (and costs). According to this monocentric model (see above figure), a large city is divided in six concentric zones:
Zone I: Central Business District (CBD) where most of the tertiary employment is located and where the urban transport infrastructure is converging, making this zone the most accessible. It would contain all of the shops and offices and was known to be the centre of attention of the town.
Zone II: Immediately adjacent to the CBD a zone where many industrial activities locate to take advantage of nearby labour and markets. Further, most transport terminals, namely port sites and railyards, are located adjacent to the central area. People living in the upper-class rural urban fringe would have to come by rail each day due to the distance of their housing from the CBD.
Zone III: This zone is gradually been reconverted to other uses by expanding manufacturing / industrial activities. It contains the poorest segment of the urban population, notably first generation immigrants living, in the lowest housing conditions. Being terraced housing in disrepair these areas due to the living standards and first generation immigrants would have a high rate of theft and crime.
Zone IV: Residential zone dominated by the working class and those who were able to move away from the previous zone (often second generation immigrants). This zone has the advantage of being located near the major zones of employment (I and II) and thus represents a low cost location for the working class. This would be a step above the previous the housing would still be of a low quality.
Zone V: Represents higher quality housing linked with longer commuting costs. This area would normally contain detached and semi detached housing. The streets are often avenues and cul-de-sacs.
Zone VI: Mainly high class and expensive housing in a rural suburbanised setting. The commuting costs are the highest. Prior to mass diffusion of the automobile (1930s), most of these settlements were located next to rail stations. In these areas often, large department stores could also be found.
According to this model, a large city is divided in concentric zones with a tendency of each inner zone to expand in the other zone. Urban growth is thus a process of expansion and reconversion of land uses. For instance on this figure zone II (Factory zone) is expanding towards zone IV (Working class zone), creating a transition zone with reconversion of land use.
Basic assumptions:
Although the main aim of his model was to describe residential structures and to show processes at work in a city, geographers have subsequently presumed that Burgess made certain assumptions:
•The city was built on flat land, which therefore gave equal advantages in all directions, i.e. morphological features such as river valleys were removed
• Transport systems were of limited significance being equally easy, rapid and cheap in every direction.
• Land values were highest in the center of the city and declined rapidly outwards to give a zoning of urban functions and land use.
• The oldest buildings were in, or close to, the city center. Buildings became progressively newer towards the city boundary.
• Cities contained a variety of well-defined socio-economic and ethnic areas.
• The poorer classes had to live near to the city center and places of work, as they could not afford transport or expensive housing.
• There were no concentrations of heavy industry.
Although the Burgess model is simple and elegant, it has drawn numerous criticisms:
The model is too simple and limited in historical and cultural applications up to the 1950s. It is a product of its time.
The model was developed when American cities were growing very fast in demographic terms and when individual transportation was still uncommon. Expansion thus involved reconversion of land uses. This concept cannot be applied in a contemporary (second half to the 20th century) context where highways have enabled urban development to escape the reconversion process and settle in the suburbs.
The model was developed for American cities and has limited applicability elsewhere. It has been demonstrated that pre-industrial cities, notably in Europe, did not at all followed the concentric circle model. For instance, in most pre-industrial cities, the centre was much more important than the periphery, notably in terms of social status.
There were a lot of spatial differences in terms of ethnic, social and occupational status, while there was low occurrence and use patterns. The concentric model assumed a spatial separation of place of work and place of residence, which was not the generalized until the twentieth century.
However, the Burgess model remains useful for approximation of concentric urban development and as a way to introduce the complexity of urban land use. Even though it may remain useful is it at all useful to the town of High Wycombe.
Soon after Burgess generalized about the concentric zone form of the city, Homer Hoyt re-cast the concentric ring model. While recognizing the value of the concentric ring model, Hoyt also observed some consistent patterns in many American cities. He observed, for example, that it was common for low-income households to be found in close proximity to railroad lines, and commercial establishments to be found along business thoroughfares.
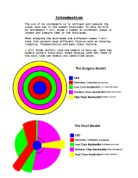
In 1939, Hoyt modified the concentric zone model to account for major transportation routes. Recall that most major cities evolved around the nexus of several transport facilities such as railroads, seaports and trolley lines that eliminated from the city's centre. Recognising that these routes represented lines of greater access, Hoyt theorised that cities tend to grow in wedge-shape patterns, or sectors, emanating from the CBD and centred on major transportation. Higher levels of access translate to higher land values. Thus, many commercial functions would remain in the CBD, but manufacturing activity would develop in a wedge surrounding transport routes. Residential land use patterns would also grow in wedge-shaped patterns with a sector of lower income households bordering the manufacturing/ warehouse sector and sectors of middle and higher-income located away from industrial sites. In many respects, Hoyt's zone model is simply a concentric zone model modified to account for the impact of transportation systems on accessibility.
His model contained the following parts of a land use model:
Zone I: Central Business District (CBD) where most of the tertiary employment is located and where the urban transport infrastructure is converging, making this zone the most accessible. It would contain all of the shops and offices and was known to be the centre of attention of the town.
Zone II: Immediately adjacent to the CBD a zone where many industrial activities locate to take advantage of nearby labour and markets. Further, most transport terminals, namely port sites and railyards, are located adjacent to ...
This is a preview of the whole essay
His model contained the following parts of a land use model:
Zone I: Central Business District (CBD) where most of the tertiary employment is located and where the urban transport infrastructure is converging, making this zone the most accessible. It would contain all of the shops and offices and was known to be the centre of attention of the town.
Zone II: Immediately adjacent to the CBD a zone where many industrial activities locate to take advantage of nearby labour and markets. Further, most transport terminals, namely port sites and railyards, are located adjacent to the central area. People living in the upper-class rural urban fringe would have to come by rail each day due to the distance of their housing from the CBD.
Zone IV: Residential zone dominated by the working class and those who were able to move away from the previous zone (often second generation immigrants). This zone has the advantage of being located near the major zones of employment (I and II) and thus represents a low cost location for the working class. This would be a step above the previous the housing would still be of a low quality.
Zone V: Represents higher quality housing linked with longer commuting costs. This area would normally contain detached and semi detached housing. The streets are often avenues and cul-de-sacs.
Zone VI: Mainly high class and expensive housing in a rural suburbanised setting. The commuting costs are the highest. Prior to mass diffusion of the automobile (1930s), most of these settlements were located next to rail stations. In these areas often, large department stores could also be found.
Basic assumptions
Hoyt made the same implicit assumptions as had Burgess, with the addition of three new factors:
• Wealthy people, who could afford the highest rates, chose the best sites, i.e. competition based on 'ability to pay' resolved land use conflicts.
• Wealthy residents could afford private cars or public transport and so lived further from industry and nearer to main roads.
• Similar land uses attracted other similar land uses, concentrating a function in a particular area and repelling others. This process led to a 'sector' development.
Hoyt's sector model
Hoyt suggested that areas of highest rent tended to be alongside main lines of communication and that the city grew in a series of wedges
(And the diagram shows this). He also claimed that once an area had developed a distinctive land use, or function, it tended to retain that land use as the city extended outwards, e.g. if an area north of the CBD was one of low-class housing in the 19th century, then the northern suburbs of the late 20th century would also be likely to consist of low-class estates. Calgary, in Canada, is the standard example of a city exhibiting the characteristics of Hoyt's model.
Limitations
Many criticisms are similar to those made of Burgess's model and have been summarized in Figure 15.15. It should be remembered that this model was put forward before the rapid growth of the car-based suburb, the swallowing-up of small villages by urban growth, the redevelopment of inner-city areas and the relocation of shopping, industry and office accommodation on edge-of-city sites.
It is important to remember that these models are generalisations and real places are all different. In recent years, out-of-town shopping centres and the replacement of inner city tower blocks with housing estates on the urban fringe has begun to change land use patterns. New housing is often built on brown field sites (cleared derelict land) instead of on the edges of the settlement.
I chose this town because it shared many of the cities characteristics and after researching was the best town to try for this case study.
Now that I have looked at an explanation for both models with pictures of the "text book town" I will now see if either of the models fit. By first looking at some of its properties I should be able to make a fairly accurate hypothesis. The parts of the town that I will have to examine will entail:
It's History, including memorials, and buildings with relevant history. This will also include its developments and its industrial changes.
The characteristics, that commonly associates it with a city
The housing situations
Its physical geographical layout
The land uses
Its accessibility
Its location in relation to London
I will now explain how the points I have made that may aid me in my case study.
It's History will give me an idea of how the town has changed and progressed over the years, it will help me to see what the town has accomplished and how it has urbanised. This is important because I am going to look at a "text book town" so it is important to look at a real one first and to monitor the reasons for its development and patterns.
Memorials, historical buildings and other intact historical elements help to give an idea of how the town used to be based, how long it has been around, it's historic relevance and it's previous occupations. It is also important to look at how it has changed industrially not only in the way of developments but also if there have been any steps backwards, this is because I need to know of all industrial factories which could change the land layout and therefore house situations and would also bring more work to Wycombe therefore more housing would be required. However small things may seem they must be taken into account.
The characteristics that associate it with a city, this is very likely to link into some of the other points I will be studying, but even though it may seem repetitive it is important to know about why the town is thought of as a city and what it shares with a city, as this is why I have chosen to do my project on it. If it does not share many characteristics with a city then it hardly stands a chance to fit into an urban land use model designed for the city.
The housing situation is important because, I need to know where the 3 different types of housing are in Wycombe otherwise I will not be able to find out whether the town fits the model or not. This will be a very large factor on the project and I must do my fieldwork to know what different types of housing are located and where. So I must locate the terraced housing areas, the detached and semi-detached housing areas and the executive housing, so that I can form my hypothesis based on information this will allow me to make an educated guess.
It's physical layout, this would be one of the most important factors bearing on the project. The reason for this is because the models may have been made assuming that the land being examined was flat, whereas High Wycombe is situated in a valley and has rivers running through it. Would this mean that the model could be in no way relevant, as it may not cater for these abnormalities.
The land uses, this needs to be looked at because I need to know about all of the different types of land uses to determine if there are any abnormalities that the models may not cover. An example of this may be the Loudwater Tesco, which is in the rural fringe and no where near the high street, what would this come under as in the model as it is a typical supermarket but is not only serving High Wycombe it is a shared service.
The accessibility of the town is very important for example any motorways would play a major factor in the services that are required and would change the layout of housing and the CBD'S layout. I would need to know of all roads into and out of Wycombe to work out if this would change the fitting into the model.
The towns location in relation to London would be very important because obviously London is the capital of England and therefore the town if was anywhere close to it would have to have a large amount of accessibility for example trains, motorways etc, as people would go too London for the large range of services, shopping and otherwise. It would also mean that many people may commute if London is not very far away as, there are many more work opportunities.
You will now be able to view the information I found for each of the bullet points underneath here as I am going to cover them now apart from the land uses research and the house situations research which can be found in my data presentation. My reason for this is because I need this information to make up my hypothesis.
Now that we have done the history of Burgess and Hoyt land use models we must do the history of High Wycombe to see how it has progressed throughout the past and to see if the model of a "text book" relates to the real town.
Boundaries drawn up by warlords and tax collectors during the Danish Invasion, would create one of the most attractive and prosperous counties in the United Kingdom.
Have you ever wondered why Buckinghamshire is long and thin, rather than radiating from a major town or city like other counties? It is because of the county boundaries formed in the 10th century by warlords and tax collectors.
Charged with raising money to equip a new castle at Buckingham and recruiting men to fight off the invading Danes, more than 200 communities and estates were grouped together, from what was the eastern edge of the Saxon Kingdom of Wessex.
The result was a county measuring 50 miles long and 10 miles wide. After the Danes were driven out of the area, the castle in Buckingham became disused and to day you can hardly tell it ever existed.
In the Doomsday Book, Buckinghamshire's population was recorded as just 25.000. For tax and judicial purposes it was divided into 18 administrative areas (known as hundreds). The 'Hundreds' can still be seen on the maps of the area today. They formed the basis of the magistrate's court divisions. In fact, had the many prospering market towns of the Middles Ages not been decimated by the Plague, the Buckinghamshire of today would look very different.
High Wycombe and Buckingham became boroughs, giving them some independence from the county administration, resulting in Henry VIII transferring the status of County Town to Buckingham's fast growing rival Aylesbury. Contention for the status of County Town between Aylesbury and Buckingham was finally resolved in favour of Aylesbury in the 18th century, mainly due to the needs of the circuit judges. A County Hall and Courthouse were built and still stand proudly in Aylesbury's Market Square.
In the early 17th century, the heavily forested woodland surrounding the Chiltern Hills was cleared - mainly for access to London. At this time great estates, such as Clivedon House and Stowe, were built.
Cottage industries such as lace making, straw plaiting and chair making developed in the county during the 18th century. Buckinghamshire became renowned for its chair making and in the late 19th century, more than 100 furniture factories existed in the town of High Wycombe alone.
From the 18th to 19th century, the growing railway network saw the development of industrial towns like Wolverton and Bletchley, now parts of Milton Keynes. Rail travel was also a key factor in the development of commuter towns along the commuter belt.
The unplanned outward spread of London was largely stopped in the 1930's by the creation of the Metropolitan Green Belt. This early environmental action enabled the London County Council and Buckinghamshire County Council to purchase and preserve large areas of attractive countryside.
Today the Green Belt extends to 50,000 hectares, whilst around half of the 80,000 hectares of the Chilterns Area of Outstanding Natural Beauty, fall within the county.
Since the 1960's, Buckinghamshire has been among the fastest growing areas in Britain, mainly due to the development of Milton Keynes. Milton Keynes' growing population of 207,800 resulted in it being split from Buckinghamshire in 1997, during a Local Government Review.
High Wycombe was first granted a market charter in 1237 and prospered for centuries through its market trading and other rural industries such as lace-making, rush-weaving and small-scale furniture production. However, it was as an early centre of mass manufacturing that the town rose to real prominence. Mills powered by the River Wye and timber gathered from the woodlands of the Chilterns were used to produce items such as paper and furniture, the architectural evidence for this remains, and some, such as the cane and rush works in High Wycombe, are still in use The bulk of the District is covered by the Chiltern range of chalk hills, which rise to over 250 metres at Coombe Hill. The Vale of Aylesbury to the north is flat clay land. The Chilterns provide much of the local vernacular building materials that characterise the District. However with chair making a particular speciality, as a result, High Wycombe rapidly evolved into the undisputed furniture capital of England, a position it held for two hundred years. At the height of its output in the 19th Century, 5000 chairs were being manufactured per day, a fact celebrated in 1880, when an arch consisting entirely of chairs was constructed, to commemorate a visit by the Prince of Wales.
Left: A picture of the famous arch made from 400 chairs in 1884 to represent the day that the Prince of Wales visiting.
Right: A picture of the town in the 1930's
The characteristics that High Wycombe shares with some cities is that it is upcoming, was granted a market charter to start out from and began to burgeon from that point. It soon found something to put it on the map as it manufactured chairs. Nowadays it is urbanization in the progress and everyday is getting stronger by numbers of people, homes and services. It now is the provider of services to a number of surrounding towns and because of it's great situation and link to the motorway it receives much business. This does not really fit into the concentric circle theory known as the Burgess's land urban land use model.
The physical geography i.e. the layout of the land really stresses on the models as neither of them talk about a city being situated in a valley because High Wycombe is. The models doesn't cater for differences such as motorways or rivers, Hoyt's model mentions something about it so it is fairly accurate, however Burgess's mentions nothing of it.
The accessibility of Wycombe is linked to then next point, however I must still reiterate. Wycombe is considerably accessible from many different approaches and has many different transport links running. Wycombe does have many services as well as luxuries and some rarities so it does attract a lot of outside attention from surrounding towns as well as outskirts. The present junction was constructed as part of the High Wycombe Bypass in 1967. It was modified in the early 1970s to accommodate the A404 Marlow Bypass. In the mid 1990s large scale improvement options were considered, including:
* The reconstruction of the junction.
* Construction of a new junction further to the south.
These proposals were subsequently rejected due to the large costs involved and the negative environmental impacts the schemes had on an Area of Outstanding Natural Beauty (AONB) to the south of the M40 motorway.
In relation to London, High Wycombe is not very far away; this is also a reason that many people do commute to and from London. This also means many different types of transport links have to be set up. It is also only an approximate 20 miles away from Heathrow airport so it is convenient for people to get there. I have provided a basic picture to give an idea of the scale.
Hypothesis
My hypothesis was that the town of High Wycombe won't suit either of the two models "perfectly" but I was not expecting it to, as the town of High Wycombe isn't a "text book town" you do expect abnormalities. I do not believe that it will fit the Burgess model at all though for the following reasons:
First because the model is considerably out of date and would only be able to relate up to about the 1950's. It was indeed a product of its time
Land use was much more different 80 years ago when the model was created.
It was not based on a small town such as High Wycombe it was based on large upcoming American cities such as Chicago. Chicago is much larger, has a massive increasing rate, is denser in population, is not a small-scale town, and has a rapid revolutionising rate. We must also realise that this model was made just as Chicago was changing in demographic terms.
Single use transport was not very common then, most people used public transport.
It does not relate to High Wycombe because America's cities origins are much different to those oh High Wycombe.
The Burgess model does not account for certain geological factors that could alter the model such as rivers, which may alter settlement area or transport links.
High Wycombe is situated in a valley, so this would almost certainly alter the towns layout and where housing would be placed, as well as transport be set up. The Burgess model does not cater for any of these abnormalities.
Now that I'm confident that the Burgess land use model does not fit the town of High Wycombe I will move onto the Hoyt land use model, and see how well I thought it would fit.
However the Hoyt land use model does have many categories that Wycombe falls into and I would say not only is the most likely of the too to fit but is a very close attempt to being the ideal model for Wycombe.
Methodology
My hypothesis was that the Burgess urban land use model did not fit at all for the reasons that were given, and that the Hoyt's model would not fit perfectly but would fit to a certain extent. However my hypothesis is just an unproved theory so now I must talk about how I will go out proving my hypothesis and the methods that I will use to collect data.
I have already studied both of the models and have tried to apply them to High Wycombe in theory to develop my hypothesis, however now to back up my opinion I must do it in practicality. To work out whether either of the models really does fit, I will have to do the following fieldwork and data collection.
Get pictures of the town in the past.
Get pictures of the town at present.
Get pictures of the different types housing and areas where they are situated.
Get the information of future proposals they may alter the land use.
Get the information from the past that may be relevant to the way that Wycombe is set out e.g. its industrial history could be a large factor.(history already done above)
Do fieldwork and find out what each of the areas of Wycombe come under for example the housing in Micklefield would class as a poorer segment of the urban population, notably first generation immigrants living, in the lowest housing conditions. Being terraced housing in disrepair these areas due to the living standards and first generation immigrants would have a high rate of theft and crime.
Get different maps of the town of High Wycombe. Mark out all of the important factors e.g. train tracks, rivers, motorways etc.
Now that I have talked about the different types of fieldwork and data collection I will be doing I will now explain why I will be doing this as well as how.
Get pictures of the town in the past, this will be done by either going to the museum or even more convenient to view a number of sites from my home. I will need these pictures, as it is important to know about the heritage of the town and how the high streets layout and services have changed. If you it may affect whether the models were ever relevant which will make it easier to determine if they are now.
Get pictures of the town at present, this is just to get some pictures of the town as it is at the moment to obviously look at the lay out but also too compare the changes from the old town. We can see how it has changed which will show us how its land use has changed over the years. This would be done by me either going out to the high street with a digital camera or by visiting a web site.
Get pictures of houses in High Wycombe, make sure you have the details of how much they cost and what they include so you can work out the different ratios of prices in each area.
Get information of future proposals, so that you can tell if the model will relevant only after the implantation of them has been done if it may become out of date when it is done.
Get maps and mark out all of important factors and try to see if either of the models fit.
In then ext section I will show all of the fieldwork that I have done and all of the data I have collected.
Data Presentation
This is the point of the project where I show all of the information that I have collected and what my fieldwork showed has me. Then I have to see if the model fits into it and why it does, but if does not then I still must say so and give a reason for it.
First I will provide some pictures that I have that were taken of the town around 30 so years ago. I'm doing this to see how much the town has changed and if there had been any significant differences back then.
Top left: The Guild hall, which still stands today
Top right: A picture of the church and memorials + its still standing today
Top left: A picture of the high street which then had a cinema built in, which no longer exists as it has been moved to the top of Marlow hill.
Top right: The infamous pepper-pot known as a small market place today and inscribed on it is the exact distance to oxford from that point.
Top left: A view up Amersham Hill
Top right: A view onto Frogmoor
Top left: A view onto Frogmoor gardens, this fountain no longer exists however a new one was recently erect.
Top right: A look down the High Street
Top left: A glimpse down Marlow road
Top right: a picture of the Rye mead paddling pool, which is now a playground.
Top left: A picture of the Royal Grammar School
Top right: A view of castle street. The Halfords visible in the pictures still on that road but has in fact moved to the shop next door.
Above: a picture looking down castle street to date.
I will now show pictures of different houses (all in High Wycombe), how much they cost and what they include. This should help me to realise the mixed variation and to see if they really do fit into the model.
Location:
HIGH WYCOMBE, Bucks
Price:
£460,000
Receptions:
2
Bedrooms:
5
A well presented family sized detached house set in a private road position backing onto National Trust Land with fine walks.:ENTRANCE HALL:CLOAKROOM:LOUNGE:DINING ROOM:KITCHEN/BREAKFAST ROOM:UTILITY ROOM:5 BEDROOMS:MASTER BEDROOM WITH EN SUITE BATHROOM:BATHROOM:GCH :DG:DOUBLE GARAGE:FRONT & REAR GARDEN WITH HEATED SWIMMING POOl : VIEWING RECOMMENDED:L
Location:
HIGH WYCOMBE, Bucks
Price:
£157,500
Receptions:
Bedrooms:
3
A mature 3 bedroom semi detached house set within approx 1/2 mile of the town centre & mainline railway station.:ENTRANCE HALL:LOUNGE:KITCHEN/DINER:BATHROOM:3 BEDROOMS:GCH:DG:GARDEN:
Location:
STOKENCHURCH, Bucks
Price:
£349,950
Receptions:
2
Bedrooms:
4
A brand new detached house set within an exclusive gated private drive in the Chilterns village of Stokenchurch.:ENTRANCE HALL:CLOAKROOM:LOUNGE:KITCHEN/DINING/FAMILY AREA:CONSERVATORY:3 BEDROOMS TO FIRST FLOOR:EN SUITE SHOWER ROOM TO MASTER ROOM:FAMILY BATHROOM:BED 4/BONUS ROOM TO SECOND FLOOR:GCH:PARKING:GARDEN:
Location:
DOWNLEY, Bucks
Price:
£99,950 (Under Offer)
Receptions:
Bedrooms:
A first floor maisonette located to the north west of High Wycombe town centre.:ENTRANCE HALL: LOUNGE WITH BALCONY:KITCHEN:BEDROOM:BATHROOM:GCH:PARKING
Location:
WOOBURN GREEN, Bucks
Price:
£219,950
Receptions:
2
Bedrooms:
3
A cottage style semi detached house set in a delightful area adjoining the River Wye.:ENTRANCE PORCH:HALL:LOUNGE:KITCHEN/BREAKFAST ROOM:CLOAKROOM:3 BEDROOMS: BATHROOM:GCH:GARAGE:GARDENS:
Location:
HIGH WYCOMBE, Bucks
Price:
£239,950 (Under Offer)
Receptions:
3
Bedrooms:
4
A spacious 1920s semi detached house set within West Wycombe Parish.:ENTRANCE HALL:LOUNGE:DINING ROOM:KITCHEN:REAR LOBBY:4 BEDROOMS:FAMILY AREA:BATHROOM:GCH:DG:PARKING:SINGLE DETACHED GARAGE:GARDEN:VIEWING RECOMMENDED:
Location:
HIGH WYCOMBE, Bucks
Price:
£395,000
Receptions:
3
Bedrooms:
3
An individual period detached house located to the south of High Wycombe within easy reach of Junction 4 of M40.:ENTRANCE PORCH:RECEPTION HALL:LOUNGE:DINING ROOM:KITCHEN/BREAKFAST ROOM:CLOAKROOM/SHOWER ROOM:STUDY/BED 4:3 FIRST FLOOR BEDROOMS:BATHROOM:GCH:DG:PARKING :GARAGE:GARDENS:NO UPPER CHAIN:
Location:
NETTLEBED, Oxon
Price:
£595,000
Receptions:
3
Bedrooms:
5
A beautifully presented detached house built in 1998, situated back from the road, close to the centre of the village and near to open country side. ENTRANCE HALL: CLOAKROOM: DRAWING ROOM: DINING ROOM: STUDY: KITCHEN WITH BREAKFAST AREA: UTILITY ROOM: MASTER BEDROOM WITH EN-SUITE BATHROOM: 4 FURTHER BEDROOMS: FAMILY BATHROOM: OIL FIRED CENTRAL HEATING: DOUBLE GLAZED WINDOWS: TWO GARAGES, EACH WITH AUTOMATIC UP AND OVER DOORS: WALLED GARDENS
Now that I have provided pictures over the housing will now do my map work.
One of the future proposals that I was able to get hold of was about The present junction was constructed as part of the High Wycombe Bypass in 1967. It was modified in the early 1970s to accommodate the A404 Marlow Bypass.
In the mid 1990s large scale improvement options were considered, including:
* The reconstruction of the junction.
* Construction of a new junction further to the south.
These proposals were subsequently rejected due to the large costs involved and the negative environmental impacts the schemes had on an Area of Outstanding Natural Beauty ( AONB) to the south of the M40 motorway.
The junction lies on the periphery of the three ancient parishes of Great Marlow, Little Marlow and High Wycombe.
Little archaeological survey or fieldwork has been carried out in the area and there is little evidence of any Roman, Saxon or Medieval settlement. It is therefore difficult to gauge the archaeological potential of the site. Preliminary analysis indicates that the scheme will not directly impact any known archaeological features.
There may be a possible slight adverse effect on the setting of Handy Cross Farm and buildings, which is a Grade II listed building and dates from the 17th Century/early 18th Century.
Data Interpretation
After looking at all of the information collected my theory has prevailed true, the Burgess urban land use model does not fit High Wycombe at all. Mainly because it was based on the fact that
The city was built on flat land, which therefore gave equal advantages in all directions, i.e. morphological features such as river valleys were removed
Transport systems were of limited significance being equally easy, rapid and cheap in every direction.
Land values were highest in the center of the city and declined rapidly outwards to give a zoning of urban functions and land use.
The oldest buildings were in, or close to, the city center. Buildings became progressively newer towards the city boundary.
Cities contained a variety of well-defined socio-economic and ethnic areas.
The poorer classes had to live near to the city center and places of work, as they could not afford transport or expensive housing.
There were no concentrations of heavy industry.
And the problem is that High Wycombe goes against most of this so it was in no way ever going to fit into the model additional problems were
The model is too simple and limited in historical and cultural applications up to the 1950s. It is a product of its time.
The model was developed when American cities were growing very fast in demographic terms and when individual transportation was still uncommon. Expansion thus involved reconversion of land uses. This concept cannot be applied in a contemporary (second half to the 20th century) context where highways have enabled urban development to escape the reconversion process and settle in the suburbs.
The model was developed for American cities and has limited applicability elsewhere. It has been demonstrated that pre-industrial cities, notably in Europe, did not at all followed the concentric circle model. For instance, in most pre-industrial cities, the centre was much more important than the periphery, notably in terms of social status.
There were a lot of spatial differences in terms of ethnic, social and occupational status, while there was low occurrence and use patterns. The concentric model assumed a spatial separation of place of work and place of residence, which was not the generalized until the twentieth century.
However the Hoyt's land use model did cater for all of these differences and Wycombe to a certain extent fitted quite well. As it did have rivers, industry, transport and other unique features in the model that were shared with High Wycombe. The main reason for it fitting was that Hoyt made the same implicit assumptions as had Burgess, with the addition of three new factors:
• Wealthy people, who could afford the highest rates, chose the best sites, i.e. competition based on 'ability to pay' resolved land use conflicts.
• Wealthy residents could afford private cars or public transport and so lived further from industry and nearer to main roads.
• Similar land uses attracted other similar land uses, concentrating a function in a particular area and repelling others. This process led to a 'sector' development.
Hoyt also suggested that areas of highest rent tended to be alongside main lines of communication and that the city grew in a series of wedges
(And the diagram of the model shows this). He also claimed that once an area had developed a distinctive land use, or function, it tended to retain that land use as the city extended outwards, e.g. if an area north of the CBD was one of low-class housing in the 19th century, then the northern suburbs of the late 20th century would also be likely to consist of low-class estates.
This was all relevant in the case of High Wycombe so it fitted in most places however the model again did not mention anything about the town being situated in a valley.
Evaluation
In an evaluation I would say that my aim was fulfilled however I also believe that I could have done it much better. Some of the possible things I could have done to make it better were
To get pictures of 3 different types of housing for each area in Wycombe.
Then I could also take pictures of the rest of the areas so that I could work out a percentage of land used. This would mean that I could plot my results in different types of graphs and tables.
I could have also found some transparencies and could have drawn both of the models so that I could put them over the maps instead of having to look at both separate.
Rather than basing my hypothesis on an educated guess I could have gone to some kind of museum to find out more information.
To provide a more thorough methodology, explaining in much more detail how I was going to go about collecting the data and doing my fieldwork.
To use more of the resources available to me and to plan my whole investigation i.e. do a rough draft before doing it in final copy straight away.
Bibliography
For my project I used the following resources:
The Internet including the:
Bite size Website
The High Wycombe council's website
The geo sites website,
And others, which have not been listed.
Also the Understanding geography second edition.
The CGP revision guide.