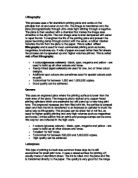
Finally, the dotted lines and circles that link the Controller with the Processor and with the Inputs and Outputs are "feed forward" and "feedback" loops. Feed-forward loops control process initiation and feedback loops controls process termination. In effect, the feed-forward loop says to the processor, "It’s time to start the process" and the feedback loop says, "The process has been correctly carried out and it’s okay to end the process." The feedback loop also controls progress toward the end result.
VALUE DERIVED FROM A PROCESS
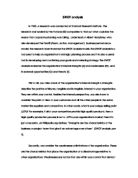
Before reengineering a process in order to streamline the same and achieve maximum possible benefit from it, it is important to identify the present positioning of the process in the organisational system and the value currently being derived from the process. Normally, the first step in a typical organisational process analysis is mapping the process on the Salience/Worth Matrix ® Peter Keen. Salience suggests prominence and salient processes are the most prominent ones. Worth of the process can normally be checked by identifying whether it’s an asset or a liability to the organisation; it’s an asset if it returns more money than it costs and if vice versa, it’s a liability.
The Salience / Worth Matrix ® Peter Keen
SALIENCE WORTH
Assets Liabilities
Identity
Priority
Background
Mandated
An Identity process is the one that defines the company for itself differentiating it from its competitors and forming the heart of the company’s existence e.g. customers identify BP as a company that consistently provides high quality products at nominal costs. Priority processes are the engines of corporate activity and effectiveness; normally hidden or taken for granted they are conspicuous only by their absence. e.g. everyone (customers, investors, govt. agencies and all other internal and external stakeholders) would expect BP to drill oil from the ground and refine & market it; however, if BP stops doing it only then would they give this process a thought. The product pricing and costing function carried out at the Financial Control Dept. of BP is another important example of a priority process. Background processes form necessary support to daily operations though their absence may not threaten the survival of the company; however, its competence may, in long run, be affected due to their absence or underperformance. e.g. reprographics / printing services at BP or housekeeping services at BP or the advertising and promotions process performed at the Marketing Dept. of BP. They are often the core of the operations at any organisation but it would be myopic to make their clear visibility a main target for management attention and investment as their improvement rarely generates much EVA. Finally, Mandated processes are those that are legally required to be performed or are justified as necessary by the company philosophy e.g. the health & safety training process for new employees at BP and maintenance of necessary fire-fighting equipment at the BP refinery.
All processes may move within the salience levels, periodically, depending on the internal and external environment requirements of the organisation; however, any process that does not form a part of the Salient set is a futile exercise for the organisation.
Moving on to the worth of the process, in simple terms a worth of the process is the EVA it contributes to the firm. A process should be undertaken by the organisation if it directly or indirectly contributes to the increase in its EVA (CFAT or PAT – CE*Discount Rate) and thereby the Shareholder Value. However, it would be wrong for the organisation to evaluate process viability only on its EVA contribution aspect; this is because there are a few processes that almost always consume more capital than the financial returns they generate. e.g. Research and Development. However, they are normally priority processes necessary for the long run survival and may currently have a negative EVA contribution but definitely lead to a positive NPV in the long run.
e.g.
Assume a typical process of laptop sourcing in an organisation. Let us first have a look at all the capital that is trapped inside this process
Suppose there are 5 people in the procurement team and their only job is to source, negotiate and create purchase contracts for laptops purchased. One for search/sourcing, one for negotiating, one for designing the contract, and 2 secretaries. Suppose they, on an average earn, £30,000 p.a. Thus the total capital trapped in employees in this department is £150,000. Suppose the other fixed capital being used solely by this team is:
-Building/Office £5,000,000
at replacement cost
-Capital Equipment
(incl. laptops, printers, furniture, etc.) £500,000
-Stationery, Food for employees,
Travel and other revenue expenditure £200,000 p.a.
TOTAL CAPITAL EMPLOYED IN THE
DEPT. FOR THE YEAR IS £5,850,000
Suppose the WACOC of the organisation is 12%; then this means that sustenance of this department requires a diversion of £702,000 from the free cash flow. Suppose the process is improved whereby the negotiator and the contract designer are replaced only by one person and one secretary is made redundant. Also suppose the team negotiates with Ryanair and the travel costs are reduced; negotiates with the caterer and food costs are reduced; replace 3 small printers with one large printer; sells all PCs as the team can work on their laptops all the time and thereby effectively, through all these changes, manages to reduce the capital employed in the process to £4,900,000. This means that sustenance of the process now requires costs only £588,000. This means that the value created from process improvement is £114,000, a direct contribution to the increase in EVA of the organisation.
Another method by which value increase in the process can be measured is to assign financials to the improvement in the KPIs of the process. One such KPI for procurement at BP is Time Taken to Award the Contract. With the total annual capital employed of £5,850,000, capital employed by this dept. per day is £16,250. With the help of the costing department, let us assume that the amount of resources allocated to finalisation, preparation and award of the contract, one of the major activities of the Procurement Department, is £7,000 per day. Assume it takes 20 days to award the contract. Hence, an implicit cost of awarding the contract is £140,000 per contract or £2,520,000 per year. If we assume that the department works only on one contract at a time then it can award 18 contracts per year and these are enough to fulfil BP’s requirements. Suppose by process improvement we reduce this time taken to 15 days, a saving of 5 days. The total implicit cost of awarding a contract now reduces to £105,000. With 18 contracts per year, the total implicit cost is now £1,890,000; a net saving of £630,000 p.a. If we assume that the WACOC of 12% p.a. then this results in addition of £75,600 to the EVA of BP.
The methodology changes a bit depending on the type of process being studied. E.g. procurement department is a cost centre hence the benefits achieved from process improvement can be measured in term of cost savings made. For revenue centre processes, this value can be measured as additional revenue generated by process improvement or for profit centre processes, the additional profits generated by process improvement.
In the last departmental meeting, Ian mentioned the possibility of Maintenance becoming the 5th or perhaps the 6th Process Accelerator. With a few assumptions and conceiving a simple yet typical maintenance process, which is a background process, the worth of the same can be calculated as follows.
1. Suppose there are 100 workers currently in the production department, each paid about £28,800 p.a. (£10 per hr for an 8 hr shift) on average. Thus the total cost of direct labour is £2,880,000. Assume one supervisor is required for every 20 workers. Thus a total of 5 supervisors will be required. If each is paid £35,000 p.a. then the total cost of supervisors is £175,000.
2. Suppose the inventory required is £300,000 per annum and there are 3 inventory turns in a year. Thus the direct material cost for maintenance process is £300,000
3. Suppose the downtime minutes for maintenance are 1000 and revenue per minute from the machine undergoing maintenance is £500 per minute. Thus the downtime cost is £500,000.
4. If the machine undergoes a rework, which is a part of preventive maintenance, for 100 minutes per annum then the cost of rework per annum is £50,000.
Let us assume that during maintenance only 10 workers and 1 supervisor are required. Thus during the time of maintenance 90 workers and 4 supervisors are idle and one supervisor is working half of his normal working capacity. Thus the total cost incurred during the maintenance process is
Workers = (1000 mins/60 mins)*£10*90 = £15,000
Supervisors = {35000 / (20*360*8*60)} * 1000 * 20 * 4.5 = £9,11.458
Thus total manpower costs during maintenance are £16,826.04
Thus total cost of maintenance is £866,826.04
Suppose there is no maintenance done at the organisation. Assume when the machine breaks down a replacement machine (assume again that it cannot be repaired if it breaks down) is required and to get the production process back online again to the original state takes 6000 minutes. The total cost incurred during this process will be:
Replacement cost of a new machine = £8,000,000
Worker manpower loss = (6000 mins/60 mins) *£10*100 = £100,000
Supervisor loss = {35000 / (20*360*8*60)} * 6000 * 20 * 5 = £6,076.39
Rework, Inventory and Maintenance savings = £850,000
Thus the total cost of not carrying out any maintenance is £ 7,256,076.39
Assume the probability of the machine breaking down in a year is 20% if the maintenance is not carried out at all (for the time being let’s assume that the probability of machine breaking down despite maintenance is 0). Hence there is a 20% chance that a cost of £7,256,076.39 will be incurred i.e. £1,451,215.28 will be the cost incurred if no maintenance is carried out during the year. However, on the other hand if maintenance is done, the cost incurred is only £866,826.04. Thus there is a cost savings of £584,389.29 if maintenance is done. If ROCE is 20 % then maintenance adds £116,877.85 to the EBIT.
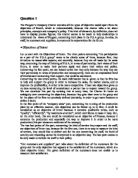
A freeing up of cash-flow as a result of improvement in the maintenance process can be shown as below.
No. of workers = 100
Annual pay per worker = £28,800
Current productivity level = 50%
Productivity level (goal) = 80%
Supervisor salary = £35,000
Inventory = £300,000
Inventory turns = 3
Inventory turns (goal) = 6
Downtime cost = £500,000
Downtime = 10% of the time
Downtime (goal) = 5% of the time
Cost of rework = £50,000
Rework as % of revenue = 5%
Rework as % of revenue (goal) = 2.5%
Worker Manpower = 50/80 * 100 = 63 workers required at 80 % productivity level
Saving of 100 – 63 = 37 workers i.e. £1,065,600
Supervisor Manpower = 37/20 = 2 supervisors can be laid off at 80% productivity levels
Saving of £70,000
Inventory = £300,000 * 3/6 = £150,000
Saving of £150,000
Downtime = £500,000 * 5/10 = £250,000
Saving of £250,000
Rework = £50,000 * 2.5/5 = £25,000
Saving of £25,000
Total Savings achieved from process improvement = £1,560,600