- Analysis of the foot-count in both areas
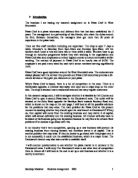
To complete this foot-count, I had stayed in the existing shop on a Saturday afternoon between 6 ‘o’clock and 7 ‘o’clock and 9 ‘o’clock till 10 ‘o’clock. Whilst I did this, I observed the total number of people that had walked pass the shop and how many people had walked in the shop or shown an interest in it. The following graph shows my results for the foot-count in the West Bromwich branch: -
As you can see on the graph, between 9 ‘o’clock till 10 ‘o’clock a total of 57 people had walked passed the shop. Out of them 57 people, a total of 12 people had walked into the shop. Whilst conducting the foot-count between 6 ‘o’clock and 7 ‘o’clock, a total of 34 people had walked in. Out of those 34 people, 5 people had walked into the shop. These are very good figures and show that Pizza Chef is a very popular firm within the area. As well as collections, most of Pizza Chefs business comes from telephone orders. Whilst analysing my foot-count results, I came to a conclusion that the other potential customers that had walked passed the shop maybe be going to another fast food take-away service where Pizza Chef is based. Next door to Pizza Chef is a Chinese Restaurant, on the other side is a Fish and Chips shop and opposite there is a McDonalds. There is a lot of competition within that area and to achieve a total 17 people showing an interest in Pizza Chef is a promising factor.
Whilst I had conducted this foot-count, I had also observed and categorised the customers by age, ethnicity and gender. I have done this because it would make my task easier to compare with the customers of Handsworth and comment on any definite similarities and differences within the areas of my research. If there is a close match in the characteristic between people who already purchase pizzas and the population of Handsworth, as obtained from my ward data, then there is every possibility that the market segment, which the business targets already exists in Handsworth. With the market segment in place it is very likely that our business can attract them to its newly opened outlet. We must therefore carefully analyse the secondary data for similarities.
Graph 2.1 (in the appendix) has given me information that I had expected. I had anticipated that more females would walk past the shop. This may be because the gender population of the ward information (that is presented further in this objective) shows that there are more females than males living in the West Bromwich area. This supports the secondary information that I had retrieved.
I had also looked at the age category whilst conducting the foot-count. I completed this by taking an estimate at the age category that the walker was. I know that this method is not accurate but the age categories of the people were obvious when they were walking past. I have done this to investigate whether Mintel’s theory that the main market for fast food is predominantly under 35 years of age and then relate this theory to the West Bromwich area. I am expecting the age categories to be around the 24-49 area because Sandwell mainly consists of people from that age group. This graph can be seen in the appendix (Graph 2.2).
As you can see on the graph in the appendix (graph 2.2), the majority of people that had walked past were in the 25-49 age category. This category holds the under 35 class that Mintel had said ‘were the main market for fast food’. By looking at my graph, I have noticed that the majority of the 25-49 group were the main people that had walked into the shop.
When performing the foot-count, I also had observed the ethnicity of the people that had walked passed the shop in West Bromwich (Graph 2.3 in the appendix). This was crucial that I done this because it would tell me what ethnic group in West Bromwich that had made that pizza shop a success and see whether there is enough of that ethnic origin within the Handsworth area to make the new branch a success if they carry out this project.
Graph 2.3 in the appendix is showing the ethnicity of the people that had walked past the shop during my foot-count. While observing these figures, I had analysed that the majority of people (at both times of the foot-count) had belong to the white ethnic race. As shown on the ward information further in this assignment, the white race makes up approximately 30.6% of the ethnic breakdown in the Sandwell area were West Bromwich is located. This is a large figure but to my amazement, I had realised that there are more people from the Asian ethnicity in Sandwell. I can not thoroughly prove why there are less Asians purchasing pizzas but there are more of them in the area but one possibility could be that a large number of Asian people in the Sandwell area may be unemployed so therefore can not afford to purchase pizzas.
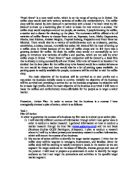
In addition to the foot-count that I had completed in West Bromwich, I also had done a foot-count on the Soho Road. I had placed myself by the possible location of the new shop and had observed the number of people that had walked past. This is not a very accurate survey because many of those people on the Soho Road may not consume pizzas on a regular basis. Whilst commencing with this foot-count, I will assume that every person that walks past the location is a potential customer.
This graph illustrates the number of people that had walked past the location of the possible shop. Assuming that all these people are potential customers, between 6 ‘o’clock and 7 ‘o’clock the foot-count result was reasonably high. This may be due to the fact that a bus stop is located 10 metres to the left of the shop with the busses coming from the West Bromwich Area were people may go to work. These people may show interest in the new company. As well as these people walking past, I had also observed a lot of older individuals shopping with younger youths and teenagers. These may also be potential customers that may show an interest. Between 9 ‘o’clock till 10 ‘o’clock, There were predominantly less people walking past the location but there was still a reasonable number. Whilst observing these people, the majority of people were mainly middle-aged males who were within a group of approximately 4. The explanation behind this maybe because they were going to the local pub which is situated approximately 100 metres away.
As with the foot-count I carried out in the West Bromwich area, I also did the same for the proposed location in the Handsworth area and once again I had observed the walkers and put them in different categories. These categories include gender balance, estimated age category and the ethnicity. I have graphed these categories in various types of bar charts because I feel that they are clearer and therefore are more effective.
As you can see, graph 2.4 in the appendix, differs from the one of West Bromwich. In the West Bromwich gender balance graph, both the times were mainly dominated by the female gender. But in the Handsworth foot-count, between 6’ o’clock and 7’ o’clock mainly females dominate the gender balance but between 9’o’clock and 10’o’clock, it is mainly dominated by the male gender. The possible explanation for more males being out at later time is maybe because they are probably going to attend the local pub (which is situated approximately 100 metres away) like explained above.
When performing the questionnaire, I had to also be aware of the age categories in the Handsworth foot-count. These age categories were approximates because it would have been to difficult and time consuming to get this accurate. Instead of that, I have made a well educated guess at the ages of walkers. The graph can be seen in the appendix as graph 2.5.
This graph (2.5) is also very interesting. Whilst observing it, I had realised that it differs a lot from West Bromwich. Firstly, between 6’o’clock and 7’o’clock Handsworth has a total of 87 people walking past the shop whereas in West Bromwich, there are considerably less with 34 people. This shows that whilst West Bromwich has a quiet afternoon, Handsworth is lively with a lot of people on the Soho Road. This is definitely a positive factor because this shows that there will be more sales (considering everyone is a potential customer). However, the theory that Mintel had said about the core Fast Food market predominantly being under 35 is not supported in Handsworth. The age categories are extremely spread out amongst themselves with the 25-49 age category just being the highest by a fragment. From looking at this graph, I have acknowledged that Handsworth has got a lot of potential customers but these people do not meet the certain requirements that the theories by Mintel had stated. Although there are a large number of 25-49 year olds in Handsworth, the question is if they are willing to buy the pizzas?
When performing the foot-count, I also recognized the ethnicity of the people that were walking past. I did this so that I can compare the ethnicity of the customers from Handsworth and West Bromwich. As Handsworth is a multicultural society, I am expecting there to be less people from the white ethnic origin and more Asian and Black people. This is illustrated as graph 2.6 in the appendix.
This graph (2.6) displays the ethnicities that I had documented down. This graph has supported what I predicted because it shows that there are more Asians and Black people in my foot-count. This graph tells me a lot about the customer base of Handsworth and also has a major difference from West Bromwich because there were respectively a low number of people from the white ethnic origin. By looking at this graph, I knew that this was going to occur because of Handsworth’s multicultural society. The main problem is, are the people of Handsworth (who show different customer bases) willing to make Pizza Chef Handsworth Branch a success.
As well as gathering data such as my foot-count to show the customer characteristics in the area, I have also obtained secondary data such as ward information. This ward information consists of data from both my areas of my research. The data consists of ethnic origins in both the areas, population, unemployment figures, gender population and age structure in the area. All these attributes will help me to make a decision to whether residents of the Handsworth area have got similar characteristics as the West Bromwich area and therefore be prepared to buy pizza’s and make the second outlet a success like the first one.
All these statistics will give me necessary information, which could give me an approximate idea about consumer spending within the areas stated. These sources of information should provide me with sufficient data that will supply me with the approximate consumer spending on fast foods in the Handsworth area. For example, if there is high unemployment in the Handsworth area then it is likely this project will be a failure due to residents of Handsworth not having sufficient finance to purchase pizzas.
In this ward information, I am expecting employment figures to be low for Handsworth and also the ethnic origin within the two areas will also differ immensely. I expect there to be a higher number of people from the Asian and Black origin. This may be because the Multicultural society of Handsworth and also because Soho Road is a traditional and cultural road for people of Asian origin. I am expecting employment figures to be low because job opportunity within the Handsworth area is very low and many of the residents of Handsworth have come from abroad and therefore have not got sufficient qualifications to get a job.
Most of these matters are already covered with the primary research that I have done but I now want to have a look at actual figures so I can see how accurate my primary research figures are.
I have put in the ward information in the appendix of this project and have highlighted the key facts that are given to me. I have obtained this ward information from the Internet and the source is from the 2001 Census Figures that had taken place. I will analyse the ward facts in more detail and provide a judgment to whether it will be influential to my final decision.
- Analysis of Secondary Data
After observing the ward information, it has given me both positive and negative elements to whether the branch should be opened in Handsworth. My main aim in this objective was to consider whether the customer bases in both Handsworth and West Bromwich were similar. After examining the secondary data, I have come to a conclusion that the consumers in both areas of my research do have distinct differences, which do not support my idea for opening the shop.
A negative factor is that the Sandwell area (where Pizza Chef is currently based) has got more residents than the Handsworth area. They are 1702 more potential customers in the Sandwell area than in Handsworth. Although there is less population in Handsworth, the similarity is that, in both cases the most popular age category is the 25-44 category. This is positive factor because according to Mintel ‘the core market is under 35’ and this category has got the most people in therefore there are a lot of potential customers.
I also have got secondary information on the gender balance in the two wards. There is a similarity in the two wards because in both cases there are more females then males. This is a positive factor because when I had conducted my foot-count, I had realised that more females had actually walked passed and into the shop. In Handsworth, the foot-count for the gender balance had varied with more females between 6’o’clock and 7’o’clock, and more males between 9’o’clock and 10’o’clock. According to past experience of working in Pizza Chef, I had also realised that females are more reluctant to purchase pizzas, which is a positive thing.
The major difference between Handsworth and West Bromwich is the ethnic groups within the areas. Although my figures state that there are more Asians in the West Bromwich area, my primary research had shown that more people from the white ethnic group were in West Bromwich than in Handsworth. I cannot thoroughly explain why this is the case but I feel it is because people from the white ethnic group tend to prefer fast food over people from the Asian ethnic group who also have there traditional evening meal (e.g. chapatti’s) to consume which may decrease the number of Asians buying pizzas. If I am correct in thinking this, then setting up the new business in Handsworth will not be a success because people from the Asian ethnic origin will not purchase pizzas and therefore Pizza Chef Handsworth Branch will not make enough sales to break even and therefore could go into a massive decline.
Other interesting facts I had found whilst reviewing the secondary data was the unemployment levels in the 2 areas. This piece of information is crucial because if there is a high unemployment rate then people will tend to save more of there money which therefore means that they will not spend on luxury items (Pizza) as much as anticipated. When analysing the figures, I had observed that a total of 18.5% of Handsworth’s population was unemployed compared to West Bromwich whose unemployment rate was 9.8% (unemployment sheet). This is considerably low compared to Handsworth’s figure. Most of this unemployment has occurred in the 25-59 age category (ward info), which is the core market for Pizza Chef in Handsworth. Because the unemployment figure is so high in Handsworth, it will have a side affect of the number of people purchasing luxury items like pizza so there will be a massive decline in sales and therefore Pizza Chef will find it hard to break even.
Although the number of people in the market is high in Handsworth, I feel there is not enough demand to sell pizzas in Handsworth therefore I believe that conducting a questionnaire for the population of Handsworth will give me a better idea of the demand that will be there for Pizzas in Handsworth. By doing this, it will certainly influence my decision to whether Pizza Chef should open the second branch. At present I feel that Pizza Chef should not base there branch in Handsworth because of what my primary and secondary data has illustrated to me. It has shown me that Handsworth mainly consists of people from the ethnic minority groups. These people within these groups tend to pay less money on fast food therefore it would be unwise to set up another shop in Handsworth.
- To establish demand for Pizza’s from the proposed shop in Handsworth.
In this section of my assignment, I will be required to carry out further primary research to reinforce the secondary data that I had retrieved earlier. This primary research that I will obtain will be in the form of questionnaires that I will ask to the residents of Handsworth. By doing this, hopefully I will get an understanding of the viewpoints and opinions of the people in Handsworth and whether they will be for or against the idea of another pizza shop opening within the area.
Before I construct this questionnaire, I will need to detect some key questions that will directly help my research with both quantitative and qualitative data. I have favoured a few questions, which I hope will tell me positive information about the market in Handsworth. These questions include: -
- How often do you buy pizzas?
- How much are you willing to pay for a pizza?
- Is there currently a pizza shop in the area that you use? If yes, please give name.
- How long are you willing to wait for a pizza?
I feel that these four questions are going to be crucial in my research. These questions will identify if the population of Handsworth show a sufficient amount of demand in the proposed outlet. It will tell me what factors I would be required to do to keep the customers of Handsworth satisfied with the service we have to offer (for example, price, waiting time). In order to be successful, these 4 key questions have to be met by the management of Pizza Chef because this is what the public of Handsworth area expecting of the business.
Before I perform this questionnaire, I will have to conduct a pilot questionnaire on a sample of 10 people. A Pilot questionnaire is a sample questionnaire to see whether the questions you have constructed are correctly structured and also give you the information that you require. After I have conducted the Pilot questionnaire on the 10 people, I will analyse the answers that were given and then see if any amendments are needed to get maximum data from the questions.
Once the Pilot questionnaire is completed and analysed, then I will construct the sample questionnaire that I will ask on 80 people. This questionnaire will hopefully give me the data I require. Then I will graph this data so it is visible and easy to understand. Once this has been achieved, I will then analyse and evaluate the key questions in the questionnaire and briefly talk about the other questions.
On the next page, I have put a copy of the pilot questionnaire: -
Pilot Questionnaire
- How old are you? Please State_________
- Do you buy Pizza’s?
Yes No
- How often do you buy Pizza’s? Please State____________________
- Do you…
Eat In Take Out (collection) Delivery Make at home
- How much are you willing to pay for a Pizza?
Small…………__________
Medium………__________
Large…………__________
- Do you have any unusual toppings? Please State________________
7) Is there currently a Pizza shop in the area, which you use?
If yes, Please State name.
Yes No If yes, please state Name___________________
- How long are you willing to wait?
Please State: - _____ hours ______ minutes
- Which method is most convenient for ordering?
In Store Phone Internet Fax
- Which facilities in the Pizza shop are important?
Seating Tables Toilets Other______________________
THANK YOU FOR COMPLETING THIS PILOT QUESTIONNAIRE.
After carrying out the Pilot Questionnaire (displayed on the previous page), I had also considered making many amendments. Many of these changes were made to structure the questionnaire better so I get all the appropriate information necessary.
Here are the results I had retrieved from the Pilot questionnaire when I sampled the 10 people randomly: -
After completing this pilot questionnaire and analysing the answers, I felt that the questions had given me the information that I was acquiring. However, I feel that it would make my analysis easier if I had categorised a few of the answers to the question. Now I will make a few amendments to my questions to make the questionnaire easier for the people to answer and also easier for me when I collate all the data. Here are the changes I have made to my questionnaire: -
For question 1, I have decided to categorise the ages rather then letting people write their age. I feel that it would make my collating of the data much easier and the main factor to why I made this change is so that the people I ask do not feel intimidated by their age. The new format of this question is as follows: -
- What age group do you belong to?
0-16 17-26 27-36 36-45 45+
I have also made changes to Question 2. I considered that maybe all people that I ask questions to do not buy pizzas due to many reasons. One reason may be that they prefer making pizzas at home rather then purchasing from an outlet. Therefore I have re-worded this question so that it tells me if people eat pizzas rather then if they buy pizzas. Here is the new question: -
- Do you eat pizzas?
Yes No
I have also decided to amend Question 3. I feel that if I put the answers to this in a category form, it will be easier for the person to answer and will also be easier for me to graph especially because of this being one of my crucial questions. Here is how I will ask the question now: -
- How often do you buy pizzas a month?
0-5 6-10 11-15 16-20 21+
Whilst analysing the pilot, I have also decided to amend Question 5. I also want to categorise all the options because I feel it will be easier for me to collate the information and also easier for the person in the sample to answer the question. Here is how I have decided to construct the question: -
- How much are you willing to pay for a Pizza?
Small…… £0-£5 £6-£10 £11-£15 £15-£20 £21+
Medium…£0-£5 £6-£10 £11-£15 £15-£20 £21+
Large……£0-£5 £6-£10 £11-£15 £15-£20 £21+
The final question I have decided to amend is Question 8. I feel that if I put this question into category form, then the person answering it would find it easier to answer. One key factor with questionnaires is to make it easy for the answerer so therefore I have decided to put it in category form. Here is the new question: -
- How long are you willing to wait for a pizza?
0-10 mins 11-20 mins 21-30 mins 31+ mins
I have also decided to include another questionnaire into my questionnaire. This question will tell me is the people of Handsworth are willing to purchase pizzas from a new firm that has just started within the area. This question will therefore tell me how many people are willing to try Pizza Chef pizzas when it has opened.
The question I will use to do this is: -
- Would you purchase a pizza from a new firm, which has just opened in Handsworth?
Yes No
Now I have made all the amendments, on the following page I have left a copy of the final questionnaire, which I will conduct on a sample of 80 in Handsworth: -
Questionnaire to the population of Handsworth
1) What age group do you belong to?
0-16 17-26 27-36 36-45 45+
2) Do you eat pizzas?
Yes No
3) How often do you buy pizzas a month?
0-5 6-10 11-15 16-20 21+
4) Do you…
Eat In Take Out (collection) Delivery Make at home
5) How much are you willing to pay for a Pizza?
Small…… £0-£5 £6-£10 £11-£15 £16-£20 £21+
Medium…£0-£5 £6-£10 £11-£15 £16-£20 £21+
Large……£0-£5 £6-£10 £11-£15 £16-£20 £21+
6) Do you have any unusual toppings? Please State________________
7) Is there currently a Pizza shop in the area, which you use?
If yes, Please State name.
Yes No If yes, please state Name___________________
8) Would you purchase a pizza from a new firm, which has just opened in Handsworth?
Yes No
9) How long are you willing to wait for a pizza?
0-10 mins 11-20 mins 21-30 mins 31+ mins
10) Which method is most convenient for ordering?
In Store Phone Internet Fax
11) Which facilities in the Pizza shop are important?
Seating Tables Toilets Other______________________
THANK YOU FOR COMPLETING THIS QUESTIONNAIRE.
Whilst preparing the questionnaire, I also had to think about what sampling method I would use. A sampling method is a process of collecting information from a population, which is either unknown or too large to ask everyone. There were a range of sampling methods that were available to me but I have decided to choose the convenience sampling method. Here I have discussed a few methods that I had considered.
The most popular type of sample is the random sample. This is where ‘when every person in the population being surveyed has the same chance of being selected’. This is a very good method of sampling in my case but the location of the sample would be irrelevant. I want to sample the population of Handsworth and if I carried out this method, I’d have to sample the population of Birmingham, which is irrelevant to my research.
Another sampling method that I considered was the cluster sampling method. This is a ‘Relatively intense sampling of the same small area’. This was an ideal sampling method but this sampling method would be time consuming to conduct and also may be expensive. That is the reason why I have not decided to conduct the questionnaire with this sampling method.
The sampling method that I have decided to use is the Convenience sampling method. This is ‘any convenient place were large groups of people congregate as the location for conducting interviews’. This method is ideal because I can then use the Soho Road as the place to conduct the questionnaires. Soho Road has many people gathering on it because of its Asian and Afro-Caribbean shops. Then I will conduct the questionnaire with a face-to-face interview. This is the most quickest and easiest way and I will ensure that all questions were answered appropriately. I feel that this convenience sampling method with face-to-face interviews is a really reliable method and will be fairly easy to conduct. This is why I have decided to select this method over the other two.
- Here are my results for the Questionnaire: -
Question 1 Question 2
0-16 = 4 Yes = 73
17-26 = 13 No = 7
27-36 = 27
37-45 = 32
45+ = 4
Question 3 Question 4
0 – 5 = 43 Eat In = 18
6 – 10 = 34 Collect = 19
11- 15 = 3 Deliver = 33
16 – 20 = 0 Make At Home = 10
21+ = 0
Question 5
Small _ Medium Large
£0 - £5 = 63 £0 - £5 = 28 £0 - £5 = 3
£6 - £10 = 17 £6 - £10 = 45 £6 - £10 = 17
£11 - £15 = 0 £11 - £15 = 7 £11 - £15 = 47
£16 - £20 = 0 £16 - £20 = 0 £16 - £20 = 13
£21 + = 0 £21 + = 0 £21 + = 0
Question 6 Question 7
Tuna – 12 Yes = 69
No = 11
Main competition came from pizza point (47)
Question 8 Question 9
Yes = 46 0-10 = 31
No = 34 11-20 = 42
21-30 = 5
31+ = 2
Question 10 Question 11
In Store = 12 Seating = 0
Phone = 64 Table = 80
Internet = 4 Toilet = 0
Fax = 0 Other = 0
Now I will graph my questionnaire results of the key 4 questions: -
- How often do you buy pizzas a month?
By observing this graph, I had gathered that most of the people from Handsworth bought pizza mainly between 0 to 5 times a month. There were also a lot of people who brought pizzas between 6-10 times within the month period. This is positive information because it shows that the people of Handsworth are willing to buy pizzas.
- How much are you willing to pay for the pizza?
By looking at this graph, I had concluded that most of the people would pay between £0 to £5 for a small pizza, £6 to £10 for a medium pizza and £11 to £15 for a large pizza. I had expected the figures to be like this because the bigger the pizza, the more I’d expect them to pay.
7) Is there currently a Pizza shop in the area, which you use?
If yes, please state name.
By looking at this graph, I had investigated that most of the people in my sample had ordered from a firm in Handsworth already. The firm that had most customers was Pizza Point, which is based on the Soho Road. Out of 80 people, 47 people had said they ordered from Pizza Point. If I base my outlet on Soho Road, Pizza point will be my main threat.
- How long are you willing to wait?
By looking at the graph, you can see that most people within the Handsworth area are willing to wait within 11 minutes and 20 minutes. If on delivery, this target waiting time could not be met because it takes approximately 30 minutes to deliver the pizza. Therefore this information does not support the opening of the outlet.
A key aspect that will influence my decision to whether I should open the shop is competition. I had studied the Handsworth area and had come to a conclusion that there was a lot of competition within the Pizza trade and the Fast Food trade.
This has influenced my decision in a negative way because I feel people will be less reluctant to try a new outlet such as Pizza Chef Handsworth Branch. If they are a regular at one shop (e.g. Pizza Point), then I feel that they would remain customers at that pizza shop and ignore any other pizza outlets that have opened.
If I am correct, then Pizza Chef Handsworth Branch would find it extremely difficult to break even and therefore this may have drastic consequences like Pizza Chef going into liquidation.
In the appendix, I have included maps to show the competition within the Handsworth area. These are labelled map 1 and map 2. Map 1 shows the other Pizza Outlets based in the Handsworth are and Map 2 shows the location of ALL Fast Food restaurants in Handsworth.
- To establish potential revenue from, and costs of establishing new outlet in Handsworth.
In my final objective, I will have to determine whether opening the new outlet will be a worthy investment for Mr Chohan. In this section of my assignment, I will estimate and calculate the approximate contribution that Mr Chohan and Pizza Chef will make if they go ahead with this transaction, and I will also look at the total cost for setting up the outlet in the Handsworth area.
My first aspect of this objective is to calculate the estimated contribution that Pizza Chef Handsworth Branch will receive. According to Business Studies for AS by David Dyer contribution is, ‘costing which ignores fixed cost and basis decisions only on the difference between the sale price of the unit and its variable cost. The formula for calculating contribution is: -
Contribution = Selling Price – Variable Cost
A crucial question that will help me to calculate the estimated contribution for Pizza Chef Handsworth Branch is question 8 on my sample questionnaire (page 20). This question is ‘would you purchase a pizza from a new firm, which has just opened in Handsworth?’ From the responses of this question, I will try to calculate the approximate contribution that the proposed Pizza Chef may make in a month.
- Referring to question 8, a total of 46 people are prepared to give the new outlet a try.
- I will now have to look at how much percent was of the Handsworth market were those 80 people that I were part of my sample for the questionnaire.
- 7117 is the total core market for pizzas (between 25 and 44)
- 80 is the number of people I questioned in my sample
80 _ = 0.011240691
7117
0.011240691*100=1.12406913
Therefore, them 80 people I questioned in my sample, makes up 1.12% of the core target market (25-44) in Handsworth.
- I am aware of the 70%, 30% theory, where 70% of those people who said they definitely would come actually do, and 30% of those people who say they would come are unlikely to come.
Therefore, I need to calculate 70% of 50 to get an approximate of how many people will actually come.
46*0.7=32.2 (32 people will approximately come).
- Now I will need to calculate an approximate for the number of Pizzas the new outlet will sell.
32 * 100 =2857.14 (2857 pizzas are estimated to be sold per month)
1.12
- Now I will calculate the contribution that each pizza makes.
- Average price for pizza = £8
- Average cost to make pizza = £2
Contribution = £8 - £2 = £6(contribution from each pizza is £6)
- Now I intend to calculate the contribution per month considering they sold 2857 pizzas.
2857*£6 = £17,142 (contribution per month = £17,142)
With that £17,142, I will need to pay off all the overhead costs that may incur when setting up the business, here is a table to show the overheads that Mr Chohan may need to pay off. All these are calculated on costs on a monthly basis: -
Profit = Total revenue – Total cost
Profit = 17,142 – 9632.30
Profit = 7509.7
Above I calculated the expenses that Mr Chohan will have to pay. As you can see, there is a total of £9632.30 of overheads that he would need to pay. If this is deducted from his contribution per month, it will leave him with £7509.70 net profit per month. Whilst I had a conversation with My Chohan, he had told me that his existing business currently makes approximately £12,000 net profit per month. As you can see, the estimate for the proposed shop is considerably low compared to the existing business. This does not support the idea of opening the new outlet because Mr Chohan will not make as much net profit as the first outlet.
My second aspect of this objective is to calculate the approximate costs of establishing the proposed outlet in Handsworth. Here I will look at the costs incurred to actually set up the proposed shop and decided whether Mr Chohan should go ahead with this transaction.
There will be many factors that will have to be taken into consideration whilst setting up and establishing the new outlet. The main cost incurred will be the property, but because there is a property on lease on the Soho Road, Mr Chohan does not have to invest into to buying a property. He may only lease it out for about 5 years and pay the rent on a monthly basis.
Here are the costs that will be necessary to set up Pizza Chef Handsworth Branch: -
Here I have created a table showing the costs that will have to be incurred if Mr Chohan is to set up the new branch. The total has come up to £19,575. This is a very large amount of money and it would be a great risk for Mr Chohan to invest this much of his own profit to the new business.
The main risk to Mr Chohan is if the Business does not become a success like the first. This will therefore be a wasteful investment. The capital to set up this new outlet will come from the profit of the existing outlet. This is then starving the existing outlet of capital and may also have a side effect, which will damage the business.
The essential items that are required to set up this business are the following: -
- Oven
- Dough Roller
- Mixer and
- Cooler
These items alone come up to a total cost of £15,000. The money to pay for these items is coming from the existing business.
I personally feel that Mr Chohan should not invest this large amount of money into a new business. It would be more beneficial if he used the money on the existing business or use it to diversify by introducing a new product.
Like I stated on the previous page, I feel that Mr Chohan should not go ahead with this transaction of setting up a new outlet in the Handsworth area. I will now go through the reasons that have influenced my decision.
My first task was to investigate whether there was sufficient demand in the Fast Food trade. When collecting secondary information, I had observed that Pizzas was among the top 4 fast food trades in the UK. This proves that there is sufficient demand in the trade and supports the idea of opening the new outlet.
Although there were more people that walked past my location in Handsworth than West Bromwich whilst conducting my foot-count, when analysing the people, I had noticed a difference in the residents. The ethnicity was the main difference between the 2 wards and my ward data also supports this. I had come to a judgement that the customers for the West Bromwich existing shop mainly consisted of people from the white ethnic origin. Whilst studying the ward information and conducting my own foot-count, I had observed that the main ethnicity in Handsworth were people from Asian and Black ethnic origin. I had also observed that people from the White ethnic group are more likely to purchase pizzas then people from the Asian or Black ethnic group.
My second objective was to investigate whether the customer bases were similar and whilst achieving the answer to this, I had realised that the customer bases had differed in both the areas. Therefore my second objective does not support whether to open the proposed shop.
Whilst completing the questionnaire, I had learnt a lot about the market of Handsworth. I had noticed that the people in my sample mainly bought pizzas between 0 to 10 times a month. This is a positive factor for Mr Chohan but the questionnaire had also told me that the main competition was from Pizza Point, which is also based on the Soho Road. Whilst analysing Pizza Point’s menu, I had calculated that their average price for a pizza was £4. Whilst studying Pizza Chef’s menu, their average cost for a pizza was £8. This is a crucial factor because I do not think that the residents of Handsworth are prepared to pay £8 for a pizza especially when 18.5% of people in Handsworth are unemployed and would rather save there money then spend it on a luxury item. This once again this information is not in favour of Mr Chohan’s proposed outlet.
I also feel that the new business will cost too much money to set up and will not make enough monthly profit. This had been shown in my last objective, where I had approximately calculated the total revenue and profit that Mr Chohan is likely to make. This profit is not enough to keep Mr Chohan satisfied and make the Handsworth Branch a success like the first one.
The peak time on the Soho Road were most people are out is on the lunch hour. Because Mr Chohan opens his outlet at 4pm, he will miss the lunch hour. If Mr Chohan would have opened his shop during the lunch hour, then I my views may have been changed in favour of the new outlet.
Graph 2.1
Graph 2.2
Graph 2.3
Graph 2.4
Graph 2.5
Graph 2.6