1289.3
0.73 times
Efficiency ratio
- Average Stock turnover
Average stock held x 365
Cost of sales 1
= 339.7 x 365 398 x 365
7232.9 1 7435.5 1
= 17 days 19days
- Average settlement period from debtors
Trade debtors x 365
Credit sales 1
= 218 x 365 _ 2750.9 x 365
7942.3 1 8301.5 1
= 10 days 120 days
(c) Average settlement period from creditors
Trade creditors x 365
Credit purchases 1
= 65.7 x 365 84.9 x 365
7232.9 1 7435.5 1
= 3 days 4 days
- Sales too capital employed or Asset turnover
Sales
Total assets – Current liabilities
= 7942.3 8301.5
- 5628.8
= 2.65 times 1.47 times
Gearing Ratio
- Gearing
Long term borrowing
Shareholders’ fund
= 1919.7 2519.6
2454
= 3.68: 1 1.03: 1
- Interest cover
Profit before interest + tax
Interest payable
= 709.4 866.0
- 45.8
= 6.9 times 18.9 times
- Total capital gearing
Prior charged capital
Total capital
65.7 + 1588.6 + 310.4 _ 84.9 + 1980 + 313.3
480.2 + 1588.6 + 310.4 651.2 + 1980 + 313.3
82.6% 80.8%
Investment ratio
- Dividend per share
Total ordinary dividend
Number of ordinary shares in issue
= 203,300,000 263,200,000
1,658,095 2,265,144,934
= 12.2p 11.6p
- Dividend yield share
Dividend per share
Market value per share
= total ordinary dividend
number of ordinary shares in issue
Market value of share
From (a) above, dividend per share were as 12.2p and 11.6p respectively for 2005 and 2004.
12.2 11.6
344.75 283.25
0.0354p 0.0409p
- Earning per share
Earning available to ordinary shareholders
Number of shares in issue
= 442,000,000 563,000,000
1,658,095 2,265,144,934
= 26.6p 24.85p
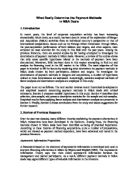
Chapter 3: Findings and Analysis
As the chief financial officer of Marks and Spencer, I have the pleasure in reporting the performance of the company. This is after a careful review of the published accounts for the year ended, April 2005.
Profitability
The return on capital employed by the company which compares the capital invested and the profit that accrued to the company showed a remarkable improvement. The ROCE increased from 15.76% in 2004 to 23.68% in 2005. The increase which represents a 50.25 per cent is well above the risk free return we could reasonably expect from M & S. it is worthy of mentioning that the ROCE is a combination of the net profit margin and asset turnover. Thus, the two give an indication of the overall performance of the company.
Below is a breakdown of the values for the period under review.
Year ROCE Net profit Asset turnover
2004 15.76% 10.43% 1.47 times
2005 23.68% 8.93% 2.65 times
The above illustration shows the values of the other two ratios namely; net profit margin and asset turnover. In 2004, the net profit margin was 10.43% but decreased by 14.38 per cent to 8.93%. In addition, the asset turnover was 1.47 times in 2004 but 2.65 times in 2005. The improvement represents an 80.27 per cent increase in the number of times sales increased when compared with the long term capital employed. In this situation, the assets of the company were fully utilized. Furthermore, ROSF which was 22.94 in 2004 increased to 84.77 in 2005. The shareholders will be quite confident of their investment due to the significant improvement. However, the net profit margin shows that revenue in relation to other cost decline. This is because interest expense increased, sales declined and, or so much discounts were offered.
Efficiency
In the current year, there was a significant improvement in most of the elements of the working capital. In 2004, the stockholding was 20days. However, it was 17days in 2005. This improvement shows that stock turnover has increased by 3days. It suggests that the company intensified their marketing campaign, offered credit facilities, good customer relationship management amongst other reasons to boost sales. This situation could cause the business a problem of running short of a stock item making customers to find it elsewhere.
In 2004, it took the debtors of the business 120 days to pay the amount owing whereas in 2005, it reduced to 10days. It suggests that debtors now pay promptly within 10days.Maybe, they were offered discounts. The discount should be compared with the initial position if it were not given and adjudge which is better. This is a significant improvement to the speed of cash inflow of the business. That is a 91.66 per cent improvement. However, it may suggest that the company became more stringent on its debtors to pay up. This action might deter customers and cause them to seek a competitor like TESCO, ASDA etc who gives a longer period for credit. Sometimes, discounts are given but is reduces the profit of the business marginally.
In addition, it took an average of 4days for the business to pay its creditors in 2004 as against 3 days in 2005. It suggests that the business can at the shortest possible time pay its creditors. The creditors will be willing to advance more credits to the business knowing fully well that Marks and Spencer can readily pay. But, it will reduce the liquidity of the business.
Gearing
From the computations, the gearing ratio in 2004 was 1.03: 1 as against 3.68: 1 in 2005. It showed a 257.28 per cent increase in the gearing ratio. The implication is that the financial risk of the business has increased by well over 250 per cent. The above scenario is attributable to the insufficient shareholders fund, loan interest is allowable charge against tax, borrowed funds exceed the lost of paying interest.
In other words, in 2004, for every pound owned, the company owes £1.03. In this situation, for every pound owned, the company owes £3.68. High risk it is! This could lead to bankruptcy if necessary measures are not adhered to. In a nutshell, this high percentage indicates a high exposure to financial risk because it means that there are interest charges to be met and a requirement to repay the loans on the due date.
Furthermore, in 2004, the interest cover was 18.9 times whereas in 2005, it reduced drastically to 6.9 times representing a 63 per cent reduction. The reduction shows that the profit of the business can hardly pay for the interest. In this situation, the lenders are at high risk that interest payable will not be met by the business. This will possibly cause them to stop lending their patronage to the company. The interest cover dropped because the company is paying so much interest on the long term liabilities.
However, if cash flow and profits are well established and secure, then the business can normally afford a higher gearing ration.
Liquidity
The liquidity of the business is very vital to the company’s survival. In 2005, the current ratio of M & S was 0.64 times as against 1.1 times in the previous year. This is a 41.81 per cent reduction in current ratio. It goes to suggest that the current assets of the business have reduced drastically when compared with current liabilities. It suggests that the cash flow has reduced and that the business might not meet its obligations as they fall due. The business is paying so such on interest for the long term liabilities. Though, some companies operate on a tight current ratio, the death of the business could be imminent if control measures are not taken.
However, the current ratio will have to be compared with the industry average. In retail industry which M & S engages in, there is steady cash inflow unlike in a manufacturing outfit where the cash inflow takes a longer time. The company should manage it well bearing in mind that it raises some concern over the health of the business
The acid test ratio declined to 0.38 times in 2005 as against 0.89 times in the previous year. In the previous year when it was 0.89 times, it was not good. It worsened by plunging further down. The acid test is a more stringent measure of the survival of any business. In this case, short term creditors are demanded for payment and possibly, there was a decline I sales volumes.
Investment
The business showed a 7.26 per cent increase in the value of earning per share. In 2004, it was 24.8p whereas it climbed to 26.6p in 2005. Similarly, the shareholders will be a little happier due to the increase in the dividend per share which was 12.2p in 2005 as against 11.6 received in 2004 representing a 5.17 per cent increase.
In addition, the earning per share increased slightly. The shareholders might not likely be comfortable with such increases. The shareholders have refused to invest further in the company probably because the returns is not commensurate their investment. They had opted for other investments that ensure compensated returns.
Chapter 4: Discussion
After a critical analysis of the findings, it was observed that the shareholders fund in 2004 was very high when compared with the figure in 2005. This was a significant drop. Moreover, the number of ordinary shares in issue in 2004 was about 2.2 billion as against 1.6 million in 2005. The shareholders who are the owners of the business did not have enough confidence so as to commit their hard earned resources. The reason, being that their investment could go down the drain.
Findings revealed that the long term liability of the company was over 3.6 times higher that the equity fund of the business. This translates that the business is at a very high risk. In addition, the interests cover dropped drastically. These factors send the wrong investment signal. Investment is at risk and one needs to exercise great caution when dabbling into it.
Furthermore, in 2004, the current assets were greater that the current liabilities. But in 2005, current liabilities were in excess of the current assets. This is definitely not a healthy financial position for the company. The current assets should at all times be greater than current liabilities, at least 1.5 times.
Nevertheless, the company is on the path of profitability. The ROSF and ROCE which measure profit with comparison to capital employed suggest that. This should not be taken for granted in the light of the high risk associated with business.
In view of that, one can not say for certain that the company is doing well. The net profit margin dropped, showing that revenue in relation to other cost decreased.
Chapter 5: Recommendations
The board of directors should do exceedingly well so as to get the patronage and support of the shareholders once again. The company should improve its sales turnover in the subsequent years, declare good dividend, and acquire a better market image that will bring back market confidence. By so doing, the market value of the share will raise and investors will be willing to once again, commit their resources.
The company should review its borrowing policy. They should refrain from increasing their non equity capital. This is because the interest payable eats up the profits and it could be a ‘golden cuff’
The company should strategically improve its products by ensuring better quality that meet the customers needs and satisfaction enhanced with better pricing. The competitors should be watched closely or used as a benchmark to ensure that the company remains competitive. Nonetheless, the company should be more innovative in areas of product development and delivery.
They should stop over trading. Their assets were over utilized. It resulted in more charges which reduced their profit for the year. In this instance, the company should find the optimal trading level.
They management as a process should identify the less profitable products, reduce their cost and discounts, increase their prices, or modify the products so that they can command higher sales price.
In addition, management should ensure that new products improve the overall profit margin other of the business. To deliver better product, they need to buy better, buy smarter and buy more quickly.
The management should place emphasis on budgets and budgetary control measures. They should be used to their full potential to ensure that strategic and operational objectives of the business are met. Great emphasis should be placed on sales, total production and overhead budgets.
The cost of research and development should be moderate to ensure optimal level. The product life cycle and the age of the product will be examined to meet with the challenges of changing taste and choice.
Financial decisions should not be made in isolation. All the department of the company should be involved when such decisions are made. Proper cash flow should be planned.
The management should as a matter of urgency look into the looks of their store environment which may have a negative influence on customers. They should restructure it to meet customers expectations by improving the in- store decoration and signage.
.
References
- one stop leadership,
Jeremy Kourdi
Published by ICSA,
1999, london
-
Financial accounting, an introduction, Pauline weetman, 3rd edition, 2003, Essex, Pearson education limited.
3.
4
5
6.
MBA
UNIVERSITY OF WALES
PROJECT DESCRIPTION: PERFORMANCE REPORT ON MARKS AND SPENCER
STUDENT’S NAME: IGBUDU SIMON ONYEKACHI
STUDENTS NUMBER: MARCH 2006, 0501743
MODULE NAME: MANAGERIAL ACCOUNTING AND FINANCIAL REPORTING
MODULE NUMBER: WAMB4004
LECTURER’S NAME: MR SAINEY FAYE
SUBMISSION DEADLINE: MAY 11, 2006.
PLAGIARISM STATEMENT: THE WORK IS MINE AND MINE ONLY.