Operating profit of £262m was 14.2% higher than last year. Property profits and interest receivable pushed pre-tax profit up to £277m, an increase of 13.8% compared to the £243m last year.
Consolidated Balance Sheet
The balance sheet remains extremely strong with no borrowings other than normal overdraft facilities and £166m of net cash. This was increased from £115m at the beginning of the year due to careful management of working capital and despite capital expenditure of £254m. Shareholders funds have raised from £1,114m to £1,253m an increase of 12.5%.
Financial Ratio Analysis
1: Profitability
Gross Profit Margin=1106.4/4288.5=0.258= 25.8%. The gross profit margin ratio tells us the profit, which Morrison makes on its cost of sales, or cost of goods sold. It is a very simple idea and it tells us for each £1 of turnover the business is earning 25.8p. Gross profit is the profit before taking off any administration costs, selling costs and so on. So we should have a much higher gross profit margin than net profit margin.
The net profit margin=262.5/4288.5=0.061 =6.1%. The net profit margin ratio tells us the amount of net profit per £1 of turnover Morrison has earned is 6.1p. That is, after taking account of the cost of sales, the administration costs, the selling and distributions costs and all other costs. The net profit margin is varying from business to business and from industry to industry. The gross and the net profit margins Morrison can gain is just standard rate to show the impression of their non-production and non-direct costs such as administration, marketing and finance costs to public.
The Gross Profit Margin and Net Profit Margin are not high for Morrison PLC, because the group is doing retail distribution. We can see the profit for this business is quite low based on the profit ratio analyses from Morrison.
2.Rate of Return
We will now examine Rate of Return
Well, interest rates at the bank were somewhere around 4 % in 2003 in UK, so the company did better than that; but there are many businesses that have a ROCE of higher than 14.3%. A ROCE value depends on the industry, the management, the economy and so on.
In general, the company has increase the ROCE compared with 2002, because profit increased faster than the capital employed did.
The Return on Total Assets Ratio (ROTA) has a similar meaning to ROCE.
Well, we can see a slight difference between ROCE and ROTA between the two years. This because Morrison does not borrow any money from the banks, so the company does not need to pay the interest. The total assets increased stabled and no interest to pay, as a result the ROTA and ROCE are similar.
This is not a good example to show how we need to take out the impact of interest and tax if we want to understand how well the operational managers have done with their assets.
3. Working Capital Management analyze
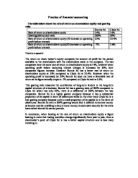
Now we will look at the liquidity ratios. First, The current ratio is also known as the working capital ratio and is normally presented as a real ratio.
The current ratio =current Assets/Current Liabilities
The current ratio is quite low for the Morrison; there will be some problem for the company to cover the liabilities in short run. The company should improve the working capital; otherwise it could be in serious trouble.
Next, we will do the acid test ratio, it is also known as the liquid or the quick ratio. We need to find out how the stocks are effect the business, when the stock can be difficult to sell or use.
The fact that the differences between the current and acid test ratios are not too large tells us that the Morison’s stocks are not that large either. The stocks are worth around £136.4million in 2003; but since current assets are £384 million, that's not a huge level of stock holdings.
Additionally, the acid test ratio has slight increased over the two-year period, meaning that the Morrison PLC has not changed it liquidity position as it had before.
Working Capital Management II: Stock/debtors/creditors
1. Stock Turnover: stock control
In principle, the lower the investment in stocks the better, modern stock control theory tells us to minimized our investment in stocks. Let’s see how the Morrison behaves in this respect.
The result of this calculation is that the answer is in terms of the number of days, on average, that the stocks are held in the business is 15.4 days, and there is slight difference between the two years in stock turnover. It shows the company makes the stock control stabled.
Debtors' Turnover
In the same way that stock control is a vital aspect of working capital management, and so is debtors’ control.
For the Morrison, the total amount owing by debtors was £22.4 million at the end of 2.Feb 2003, which as a percentage of total assets, is 1.12%. That's a small amount of money in the whole business and irrelatively, and it's only 0.6days more than it was the year before. Because Morrison does retail business, it can get the sales revenue back quickly, and the debtor collect days are quite low. It looks good for a business.
Creditors' Turnover Ratio
Creditors of the company will need to make their credit control policies in exactly the same way that the company did when they were assessing their debtors' turnover ratio. Creditors give credit but they need to control how much to give, how often and for how long. Let's do some calculations for the Morrison.
In 2003 if we had bought some supplies for £535.5m on 2nd Feb, we would have paid for them 60.5 days later on 3rd April. According to that debtors are taking somewhere only 2 days to pay their accounts, notice that the business is taking two months credit for itself in 2003 and in 2002. These results are good. The small businesses are suffering in the UK because large businesses like Morrison take too long to pay their accounts. It’s worried for small business but good for Morrison.
Investment
1.Dividend
According to the directors propose to recommend a final dividend of 2.25p per ordinary share. The total dividend in the period will be 2.70p per ordinary share compared to 2.20p per ordinary share in 2002, an increase of 22.7%.
The new market price is 245p per share, So Dividend yield=2.7/245=1.1%. The dividend yields seem to be rather low and the yield of Morrison (w) PLC is representative of the overall market. But why would shareholders accept such low yields? The answer is that shareholders are more concerned with capital gains, i.e. increases in the share price, rather than the dividend they might receive.
2. Earnings per share
The earnings per share are based on the profit for the financial period. It was 11.53p. The average number of ordinary shares in issue during the period was 1,554,853,000 (2002 1,537,431,000) or 1,581,231,000 diluted (2002 1,579,284,000) and the new market price is 245p per share.
So the Price Earnings Ratio: P/E ratio for Morrison this year is 245/11.53=21.25. It is not too high to invest and in general if the P/E ratio around 20, it means the company may be worth to invest.
Reference
All the financial information data including the background of the Morrison PLC are taking from the Internet. Nothing from the books! The website shows as below:
http:/www.bl.uk/services/information/bisheets.html