Inequality- Market failure is not just misallocation of resources; it can also be cause by inequality in the economy. In a market economy, the ability for each person to consume goods depends upon their household income. So if household income is low, this could mean an increase use in public transport such as buses. As income is low, they cannot afford to buy a car and pay MOT for the car, so the only cheap option is to travel by buses.
Misallocation of resources has a big effect on the public transport creating an economic problem. As the government wants to increase public transport and cheaper fares will have an increase in the use of public transport. If there’s more public transport, it will have an increase in global warming, too much pollution an externality is created and not enough resources are being used to clear up the problem. So now campaigns are set up, going against the government increasing public transports such as buses which increase pollution like global warming. So this has a negative externality.
Private cost and benefits are costs and benefits received by individuals, firm, area, country, etc. which engages in a particular activity. Take for instance, the bus firms who pay for the raw materials, machinery and the drivers. The social cost and benefits, is not the cost and benefit to an individual, but to the rest of the society as well. For example the social cost would be the noise and pollution it generates from the buses. Social benefits could be the convenience for people to travel to places quickly and to get there and less transports on the road.
Social Benefits= Private benefits + External Benefits (Positive Externalities)
Social Costs= Private Costs + External Costs (Negative Externalities)
Externalities in any economic (market Failure) as output is not at the optimum level. This can be shown as diagrams.
Inferior goods
This is where a good or service which experiences a fall in demand when income increases. There will be a fall in demand because consumers will react to an increase in their income by purchasing products which are to be better quality. These inferior goods commonly are:
Bread- consumers switch from this cheap, filling food to more expensive meat or convenience foods as their income increases.
Bus transport- consumers switch from buses to their own cars when they can afford to buy their own cars. So as income increase, most people will buy their own car, rather than travelling on buses. As cars could be more comfortable and takes to directly to the place o want to go to. While buses, could be poor in services, the damages and the comfortability.
Normal Goods
This is where a good or service for which demand increases when income increases. This could be holidays, if income increases, consumers are able to afford to go on holidays.
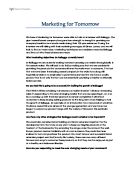
A good can be both a normal and an inferior good depending upon the level of income. Bread may be a normal good for people on low incomes (i.e. they buy more breads when their income increases). But it maybe an inferior good for higher income earners.
Normal and inferior goods are shown on the diagram above. D1 is the demand curve for a normal good. It is upward sloping because demand increases as income increases. D2 is the demand curve for an inferior good. It is downward sloping, showing that demand falls as income increases. D3 is the demand curve for a good which is normal at low levels of income, but is inferior at higher levels of income.
Demand and Supply
The quantity demanded for each good depends on the price, the lower the price the more demanded. However, demand is only effective if the consumer is willing and able to buy the good at a given price. This relationship between price and quantity demanded can be shown on a demand curve. This shows the quantity that consumers are willing and able to purchase at each and every given price, all other things unchanged. I could use a diagram to show this, how changing the price of bus fares could affect the demand for buses. Below is an example of a demand curve for buses:
However, price is not the only factor affecting the quantity demanded of a good. Other factors include:
-The price of substitutes, a good that can be used instead of another good for a particular purpose, for example if prices for cars has reduced, it means that more consumers will buy a car rather than spending their money on public transports.
-The price of complements, if the price of a complement good has fallen, then demand for buses could increase for example bus fares.
A change in any other factors other than price will see a shift in the demand curve.
The demand curve will shift outwards from d1 to d2 and the quantity demand will increase, from q1 to q2. Below are listed all the factors that can affect the demand for buses, other than lowering bus fares:
-real incomes have risen
-the price of substitute good had risen
-the price of complement good has fallen
-the product has been advertised more effectively
-the population has increases, i.e. more consumers
-there is more credit available.
The demand curve will shift to the left, from d1 to d3, and see the quantity demand fall, from q1 to q3 if the opposite of the above occurs. For example, if advertisement on global warming and pollution is advertised, this will encourage consumers to use fewer buses but to walk to work or ride a bike. If substitute goods falls, such as a car. Most consumers would buy a car, leaving less or fewer consumer demanding for buses.
Supply- According to the law of supply a higher quantity will be supplied at higher prices, all other things unchanged. This is because the higher prices will encourage firms to supply more. This relationship between price and quantity supplied can be shown on a supply curve. So if bus fares were high, more bus company would agree or willing to supply more buses for the consumers, so they are able to make more money. If more bus company are willing to supply more buses, it could also mean less congested roads, so more consumers are encouraged to use buses than cars.
However, price is not the only factor affecting supply. Other factors include the prices of factors of production- land=rent, labour=wages, capital=interest. Technology could affect the amount supplied, improvement in technology will mean production is cheaper and faster, so workers are less needed and less wages paid.
The supply curve will shift to the right, from s1 to s2, and see the quantity supplied increase, from q1 to q2 if:
-the increase in the number of suppliers
-there is an improvement in technology
-there is a fall in the prices of factors of production.
The supply curve will shift to the opposite side, if the opposite of the above occurs.
Market Equilibrium- this is very important as it solves the economic problem of congestion. If bus fares are set to a good price or other public transport such as train and the tube. The price should be adjusted until demand equals supply, this is the market clearing price. So there will be no excess demand and excess supply. But in the real world this is very difficult, as all consumers have their demanding for the right prices for public transport. But the government has to increase the prices so social cost is added to it, also the extra money they need to improve the public transport services and increase buses on roads. So adjusting the right price till demand equals supply is very difficult.
Price in a free market is fixed or ‘determined’ by the forces of demand and supply. Take the price of public transport i.e. if they want to increase the demand for public transport, the easiest way is to drop the prices for public transport, but on the other hand, if buses and train supply are reduced, this could mean most consumers are prepared to pay higher prices to obtain the public transport supplied.
-a decrease in demand or an increase in supply will reduce prices.
-an increase in demand or a fall in supply will raise prices.
Changes in prices- a change in price will come about when either demand or supply changes. For instance if raw materials cost more to build buses, and higher prices were sold to the bus company, so then the bus fares has to be increased, this would be shown by an upward curve for buses, shown in the diagram below.
As this shows the price has increased, which means that demands for public transport would be less than before.
Elasticity
This is the responsiveness of the quantity of a product to a change in the value of a factor determining its quantity. There is various different type of elasticity. Such as the price elasticity of demand- measures the responsiveness of quantity demanded to a change in price. This is calculated using the formula:
PeD= Percentage Change in Quantity Demanded
Percentage Change in Price
By using this formula, I am able to find out whether the public transport is an elastic good or an inelastic. If it came to a negative value, this shows that changing the price slightly on pubic transport will have a big effect on the demand. The demand could either go up a lot or go down, but common sense; it will go down if price rose.
Elasticity can also measure the amount of substitute goods it has, so the higher the substitute public transport, meaning more choices for consumers. So if public transport costs more, and there are substitutes then consumer might buy a car. This is known as Cross elasticity of demand measures the responsiveness of the quantity demanded of one good to change in price of another good.
Income elasticity of demand measures the responsiveness of quantity demanded to change in income. This is effective because, it can measure the amount of people who might still use the public transport is their income increased. Buses could be an inferior good, so as income increases, these goods decreases. As cars are usually normal goods.
Research Method
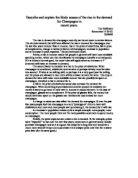
In this section, I am to create a questionnaire and surveys. Asking questions if your income increases, would you still use the public transport. Generally I am questioning people who take the buses, from a period of 12pm-1pm which is the busiest time of the day for public transports. So the place with most congestion and buses would be a good place to survey. After 12pm-1pm when I have done my survey, then I will again survey at 8pm-9pm, to measure the traffic between these two times to see a difference. I will interview ten people on the buses or people who are waiting at the bus stop. I will also time how long it took me to travel one end of the street to the other end. With two different times, from 12pm and then 8pm. Below the map which shows the street I am interviewing people and measuring the traffic.
I have chosen Lewisham High St. this is because I believe that, this street is very busy in daytimes, due to the amount of buses that travel on this street. Sp it would be very easy to interview these people who travel on this road on a daily basis.
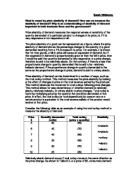
Below is a questionnaire that will help demand, by questioning people how they would like their bus fares to be. So if demand was low, the government shouldn’t supply too many buses, so then there no excess demand of excess supply, which should match the market clearing price.
At what price would you prefer your adult bus fares to be?
Please tick in the box below
-
10p
-
30p
-
50p
-
70p
-
£1
At what price would you prefer your child bus fares to be?
Please tick in the box below
-
10p
- 20p
- 30p
- 40p
- 50p
- 60p
- 70p
How would you like the buses to improve? 3 ticks maximum
Please tick in the box below
-
Better seating
-
Clean
-
Better services
-
Buses on Time
-
More Buses
-
Buses arrive at destination on time
-
Not too crowded on buses
-
Better facilities, for disable
-
Good drivers
-
The noise level
What kind of factors would encourage you not to use the Buses?
Please tick in the box below
- Income rises(buy a car)
- Prices for car falls
- Prices for petrol falls
- High prices for buses
- Convenience with a Car
- Waiting time for Buses
- New technology in Cars
- Trains more convenient
The above graph or results shows that, many people didn’t like the price of the current adult fare, and the majority prefers a 30p fare rather than a 70p fare. This means that, changing the price of bus fares has a nig affect to demands. So buses are very elastic.
The above graph shows that, the majority of people that I have interviewed demanded a 10p child fare, rather than a 40p ticket.
With these results above, I am able to show this on a demand curve.
The other part of research was to record the level of traffic from two different times.
Peak-Time: From 12pm-1pm, the traffic was high, the high street was very congested. Many buses too in the traffic. This could be one of the main reasons, as theres too many buses which congests the road nowadays. It took atleast 15min to go from one end of the high street to the other end on the bus 208. while I was on the bus, I surveyed and questioned a variety of aged people on the bus. Some whom is going to work.
Off-peak Time: From 8pm-9pm, during this time, the road was less congested, most people has gone home from work or school at this time. Buses are more empty. It was quite difficult to find people to question, as the bus stops were quite deserted. During this time it onlytook 8min approximately to travel down the high street, this goes to shows it was less congested during this time.
Evaluation
The research method I used, didn’t really work so well. Overall I believe it could have been more effective and that I could have got more out of it. The main weakness of my research method was that, I couldn’t get enough details from the people I was questioning. This could due to the fact that my questionnaire wasn’t effective enough. I could have asked more useful questions which was related to the coursework. How cheaper public transport solve the problem of congestion. The strong point of my research was that, I was able to find bout the substitutes for buses, how effective it would have been if train tickets costed less than bus fares. That more consumers will travel on train than buses. I was able to find this from the research.
If I was to carry out this research again, to improve it, I will attempt to make a questionnaire which is more relevant to the coursework. Asking them for their own opinions on the buses, rather giving them a list to choose from. As this could give me a wider range of answer to help me to solve the congestion problem in London.
Other methods that could be used to solve the congestion problem apart from cheaper public transport could be the cost for off-peak and peak time costs. For trains nows, they have a peak time cost and off peak cost. This is when in the morning, trains are very busy and so tickets cost more during the morining rush hours. But after 9:30am it is then the off-peak time when most people has gone to work, and less people are taking the train which is when the ticket price are lower. I believe that, introducing this system to buses, could solve the cogestion in roads. Rather than something like congestion charging, when driving in central London, you would be made to pay a fee of £5 everyday. Which the government believes that it will encourage more people to use public transport than using their own car.
There are many ways other than this method shown above.