Reasons for choosing a Questionnaire:
I have chosen to use a questionnaire in my research process, as it is an easy and inexpensive way of finding information from the public. However my public or the respondents I would be questioning are limited, as I would only be questioning the customers of the company. This helps me to focus on the number of people I will be sending questionnaires to in order to gain some vital piece of information to help me toward the problem I am investigating. I would be using all open-ended questions in my questionnaire as it allows the interviewees considerable scope in the responses, which they are able to offer. However I would use some leading questions, which would encourage a particular answer helping to analyse the information much easily and accurately. More consideration would be taken while designing the questionnaire in terms of the language used in the questions. The questions used would be clear and unambiguous so that they do not confuse or mislead the interviewee.
I would be using a Random Sample out of the total number of customers the company has. This would give each member an equal chance of being selected. This means that no bias can be introduced, as the members would be picked at random. However it does assumes that all the customers are homogenous or have similar buying techniques, which might be true as some customers are quite big (items of spending) and some spend a limited amount of money. It will be time-consuming, as I would have to draw up a list of all the customers to be questioned and then have to contact them.
Reasons for choosing an Interview:
In order to find relevant information about the company itself, I would be conducting an interview with the manager of the Company. The reason why I chose an interview over a questionnaire is because in an interview the interviewee has a chance to give detailed responses to questions, which concern them. The interviewer can also explain long and difficult questions and the percentage of responses that can be used is likely to be high. There is always time and scope for answers to be followed up in more detail. However it has the following limitation like I can be time consuming and rely on the skills of the interview. The interviewer can ask questions in such a manner which might lead to bias.
For my interview I wont be using any sampling method as the company has only 1 manager and 3 employees in total, so its possible to interview al the employees or the manager in this case. This interview will help me to achieve my 1,2,3,4 and 5 objective. The reason why all these objectives will be fulfilled is that I would design my questionnaire in such a manner, which would cover all the essential points to cover the above written objectives.
Questionnaire-Pilot Study
Keeping the above points in mind I have designed the following questionnaires. The first questionnaire is for the customers the company has and the second questionnaire has been designed for the interview with the manager of the company.
Questionnaire for the Customers:
- How did you hear about this Company?
_____________________________________________________________________________________________________________________________________________________________________________________________
- What do you think about their products?
_____________________________________________________________________________________________________________________________________________________________________________________________
- Do you think by selling their products, you are getting value for money?
_____________________________________________________________________________________________________________________________________________________________________________________________
- How often do you re-order?
_____________________________________________________________________________________________________________________________________________________________________________________________
- Which are the months when you sales are at its peak?
_____________________________________________________________________________________________________________________________________________________________________________________________
- Do you concentrate on relationship marketing?
_____________________________________________________________________________________________________________________________________________________________________________________________
- What sort of marketing methods would you prefer the company to use?
_____________________________________________________________________________________________________________________________________________________________________________________________
- If you were to change the existing products Impressions India are supplying, what would it be?
_____________________________________________________________________________________________________________________________________________________________________________________________
- What sort of stock policy do you use?
_____________________________________________________________________________________________________________________________________________________________________________________________
- What does your customers say about the products?
_____________________________________________________________________________________________________________________________________________________________________________________________
- What lag time would you prefer between receiving goods and paying for it?
_____________________________________________________________________________________________________________________________________________________________________________________________
- Would you prefer to pay in advance for the products ordered?
_____________________________________________________________________________________________________________________________________________________________________________________________
Questionnaire for the Interview
- How much do you spend annually on your marketing?
- What sort of marketing methods do you use?
- How would you classify your business as, a product oriented or Market oriented?
- Are your products aimed at a specific market?
- What degree of competition do you face in your day-to-day running of the business?
- What qualities of your product make it different from that of the competitors?
- What is the lag time of your customers re-ordering?
- What level of stock do you hold?
- Do you suffer from seasonal fluctuations?
- What sort of customer feedback do you get?
- Do you use cash flow forecasting?
- What is the lag time between the customers, ordering the goods and the goods being sold to the customers?
- Do you sell directly to the consumers?
- What effects does inflation causes on your business?
- Do you give Trade credit?
- What measures can you take to cut costs?
- How are you dealing at the moment with this cash flow problem?
- What sort of measures are you planning to take in the near future to solve this problem?
- Would you consider selling your shares if it solves the problem?
Questionnaire-Full Sample
After designing the questionnaires I explained each question in detail to illustrate the reasons (Appendix ) why I was asking a particular question. I also tested my questionnaire with a small sample of interviewees to find out the incorrect questions, which the interviewee wasn’t comfortable in answering. Then I came up with the corrected and the tested questionnaire, which formed the Full sample. The incorrect questions or the flaws of my questionnaire are discussed below:
-
Question 3 in the first questionnaire was a bit ambiguous and the respondents didn’t understand the question very well so I decided to change it to (Are you happy with the prices they charge?) As now it was pretty clear and the respondents took no time to answer it.
-
I removed Question 6 as it gave me information, which I didn’t needed, and wouldn’t have helped me to analyse the problem. The question was about if the customers used relationship marketing and the results weren’t needed as it didn’t had anything to do with the business and its problem.
-
I also removed Question 9, as the interviewee wasn’t comfortable in answering this question and giving up their stock policy used. I amended this question to (Do you keep a high quantity of stock?) which would help me to analyse customer’s buying habits.
-
I removed Questions 3 & 4 of the Interview questionnaire because they were unnecessary as this information wasn’t required and it didn’t satisfy any of my objectives.
-
I added another question to the Interview questionnaire When are your sales at its peak? to find out when does the business generates most of its Cash.
-
I also added How does this problem stops you as a company from achieving your objectives? This question would certainly help me to satisfy my 3rd objective and would make it easier for me to propose the likely solutions to this problem.
4.0 Research Results & Analysis
4.1 Analysis of the Questionnaire’s Results
- More than half the people I questioned said that they heard about the company through the various trade fairs they visit. This clearly suggests that this is the only promotional method through which the company is getting a high level of response. Around 27% of the respondents replied that they got aware about the company through Brochures (Direct mailing).
- This question had quite a positive response as nearly all the customers replied that they were quite happy with the products. Quality to them was the main issue and they said it was clearly met and was evident in each individual product.
- Price wasn’t a main issue for the customers as they were happy with the prices. Some people also said that since the prices are so reasonable, it encourages them to reorder more often.
-
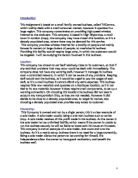
Reordering was completely on the basis when the customer runs out of the current stock.
However some customers said that they reorder every 2 months to try out the new product range where they sell their old stock at clearance prices. So each customer had a different reordering period therefore the above graph has been drawn by estimation. The graph clearly shows that the majority of the sample was not sure about their reordering period but 30 % of the customers said that it was every three months.
- The people were very sure about this question and replied very confidently. 67% of the customers replied in November and December because of Christmas. However some said that they get high sales in the months of April near Easter. This entirely depends on the area where the customer is based as Customers in Central London face an increase in demand around summer months, because of the number of tourists visiting the country at that time.
- Majority of respondents said that they pick most of their contacts through Trade fairs as they get a chance to feel the products before they order anything. Also it allows them to discuss a product with members of the management team. However some customers do read some quality furniture magazines to get new ideas and contacts. Internet is another way of finding required products, which can be searched for on search engines like google.
- Two third of the total interviewees said that they were completely satisfied with the products offered to them but some wanted the company to introduce a new range very often which will boost their sales. They commented that their customers (Consumers) usually loose interest in the product if it’s lying in the shops for period of time. They want something new quite often which would encourage them to buy. The range also plays an important part as the more number of choices they have, the more interest they would show.
- Most of the customers didn’t wanted to keep a high percentage of stock and preferred reordering on a regular basis.
- Most of the customers were satisfied with the kind of response they get from their customers. However there are some customers, which have problems with certain products, as they are slow moving items. Overall the business is having a positive response from its consumers.
- 55% of the respondents wanted a 60-day credit term where as 35% of the total customers interviewed asked for a 90-day credit term. Only the remaining 10% were wiling to pay back within 30 days.
- Only 10% of the people were wiling to pay in advance for the goods they ordered. The rest wanted to stick to their credit terms.
4.2 Analysis of the Interview Results
- The company spends around £25,000 on their marketing annually. However 2003 was their first year when they started some sort of Promotion to create awareness of their products. The promotion came in the form of trade fairs, which is Promotion below the line. The reasons why they chose this sort of marketing methods was because they felt that people will not buy their products before asking the technical staff about it. Since they deal in the furniture market, the competition is increasing everyday. So trade fairs give them a chance to tell their customers about the uniqueness about their product thus encouraging them to buy.
- Competition was also a main concern for this business as they face a lot of competition in this market. Italian furniture and Ikea were their main competitor whom they fell is dragging them out of the business. However their product do have certain qualities, which makes it unique, like the traditional Indian designs and the finishes. This however is not recognised by their potential customers, as they are more aware of the Ikea’s flat pack furniture and the exquisite Italian designs mainly because of the extensive marketing they do.
- As the customers said earlier re-ordering was completely on the basis when the customer current stock runs out. So it was every 3 months, which was the same as what the customers said. The manager also said that if the customers don’t reorder after 3 months, the company takes the unsold stock from their customers and changes it with the new range. This helps them to build better relationship with their customers and helps the potential customers to try out their range.
- They have also increased the Stock level considerably in order to meet unexpected changes in demand. 20% of the products in every container they receive are buffer stock. So currently the company owns around £25,000 worth of stock. The company does good business in the winter months October, November and December. Most of this Stock is used in these months, as their sales are high in these months. The lag time between the orders and goods being delivered is decreased in these months because of Christmas. The goods are sold to the customers as soon as the company can because it has to be sold to the consumers near Christmas.
- The company does not sell directly to the consumers and choose the second channel of distribution, which is through a retailer. Some of their customers are also wholesaler who then sell to a retailer.
- The company suffers from seasonal fluctuation most of their orders come in the months of October, November and December. So for much of the year, through, they have to pay expenses without any cash flowing in.
- The company do not use a Cash flow forecasting which makes it hard for them to predict the inflows and outflows of cash.
- Inflation causes havoc to Impression India as they are forced to increase prices (as in cost push inflation), which causes the demand for their product to decrease. Fluctuation in Exchange rates is also a problem as it’s an Import company so exchange changes leads to either an increase or decrease in prices.
- The manager of the company said that this cash flow problem is creating a lot of problems for the company. Since they haven’t got enough money to pay their creditors, they are loosing trust in the company. Paying the wages in several months have been a problem and since the profit is going down each year they haven’t got enough cash to try out the new range of the products from their suppliers. It has also disturbed their lag time of processing the orders and some of their shipments have been delayed.
- At the very moment the business is surviving very hardly as they have to pay a lot back to the creditors. They have started selling the goods at cheaper prices and have also changed their credit terms allowing the customers to pay back within 15 days of receiving the goods. They are also considering in moving to a smaller premises, which would help them save a lot.
- In the near future once this problem is solved and they have paid back their creditors they are planning to increase prices to that of their competitors. They will also hold less stock in order to save money on storage. They are also planning to use Direct mailing on a higher extent rather that Trade fairs as it works out much cheaper but it poses a risk of not being that successful.
4.3 Analysing the Secondary Research
- By looking at the balance sheet I can analyse the asset structure of the business. It shows that £2,958 was spent in the first year 2001 Tangible assets such as Van and Computer system. However in year 2002 the Tangible assets were reduced by nearly 50% to £1,973. Current assets, however, accounted for £2,248 and £13,711 respectively in the years 2001 & 2002. In Year 2003 both tangible assets and current assets have increased a lot. Tangible assets in year 2003 accounted for £5,268 and Current assets were£27,349.
- The reason for increase in current assets was an increase in Stocks in the past three years, which has increased from £1,951 in 2001 to £22,958 in year 2003.
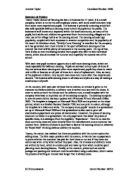
- The liability of the business has also increased from £6,875 in year 2001 to £18,605 in year 2002. This was an increase of 271% of the business’s liability in these two years where there was a further rise up of 191% to year 2003 taking the figure to £35,689. This amount is due to the creditors within 1 year. The following graph shows an increase of current assets in the past three years, side by the liability, which has also increased.
From the above chart and table we can analyse that every year the current assets increase by a certain percentage but the Liability also increase with it. However the percentage increase in the current assets every year is more that that of the liability.
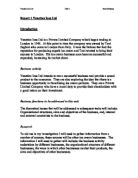
- It is also possible for me to calculate whether they have sufficient working capital using Acid test ratio.
Acid test ratio = Current assets - Stocks / Current liabilities
If the acid test ratio is equal to 1 or very close to 1, this would suggest that the business has sufficient working capital.
From the above graph I can easily analyse the company has been suffering from this working capital problems since it started trading in year 2001.
- I have also calculated the Working capital for year 2003, which is (8340) meaning the company will be or is facing problems meeting its immediate debts.
- Their profit and loss account shows that the sales have been increasing considerably for the past three years. In the first year of trading as in 2001 their sales were at £6,908, which rose up to £17,395 in year 2002. However in year 2003 the sales rose up to £88,752. This was an increase of 510.2% from year 2002. The amount of growth in year 2003 has been a reason from advertising as this was the first year when the company used some sort of advertising.
- Their operating expenses have also risen quite significantly with the sales.
In year 2001 Operating expenses accounted for 47.1 % of the annual sales. It was reduced to 45.5% in year 2002 but then it increased substantially to 55.1% in year 2003. From this I can analyse that this could be a major problem that the business is facing as their operating expenses has increased radically in year 2003.
- The Net Loss has also been rising for the past three years and is on the verge of rising for the upcoming years if considerable steps are not taken. It has been rising at 139.6% each year on average.
- My External Secondary research revealed that the UK market for household furniture has grown by 2.1% since 2001. From this I can analyse that the company has more room for flourishing.
In 2002, consumers spent on average £178 on furniture, up from £121 in 1998. This represents a 47% increase on the average amount spent on furniture.
Living and dining room furniture is also expected to continue to be the largest sector in household furniture market, estimated to make up just under 52% of the total market in 2004
4.4 Proof that the problem exists
After analysing their Balance sheet and calculating the Acid test ratio I found out that the company is facing a working capital problem. I also used the following formula Working capital = Current assets – Current liabilities to find the amount of working capital employed. The answer was in negative, which means that the company is experiencing cash flow problems. (Refer back to Section 4.3)
The liability of the business is increasing every year, as they haven’t got enough cash to pay back their debts. This also proves tat the business is facing working capital problems.
4.5 Proof of causes of problem
There are a number of reasons, which suggests why the company is suffering from cash flow problems. These are explained as follows:
-
The following graph shows that the company does good sale in the months of October, November and December. Most of the other months, more money is going out of the business rather than coming in. So they have to pay their expenses without any cash flowing in. However this is a result from Seasonal fluctuations.
-
According to the balance sheet in Year 2003 the company’s annual Sales figures were £ 88,752. The total cost of sales was £ 57,654 out of which only £34,696 worth of goods were sold. The remaining goods worth £16,538 were kept as stock. So Stockpiling is another cause of the problem. Since holding stock is very expensive and most of the company’s money is tied up in stock which is unproductive and is creating a shortage for cash.
- Overtrading is another cause, which has lead to this problem. In year 2003 the company spent a lot on advertising therefore increasing their operating expenses. They also moved into new premises, which also increased the costs. (Refer back to the Profit & Loss Account appendix ). However this might have been the main reason of growth in sales but taking an early action and spending a larger amount on advertising wouldn’t be considered as a profitable expense.
4.6 Proof that the problem stops the business from achieving its objectives
In my Questionnaire that I used for the Interview, I asked the Managing director of this firm about how this problem is stopping them to meet their objectives. He replied that this working capital problem is not allowing them to generate enough cash to pay their debts. However since this has been happening for the last three years the creditors somehow are losing trust in the company and have become very strict about the credit terms. It has also resulted in delaying of their shipments, which has disturbed their lag times of processing the orders. The customers are not happy with this outcome and some of the orders were cancelled, as the requested goods weren’t delivered on the right time. The manager also said that since the profit is going down each year it is really hard for them to convince potential investors to invest in their company even if they consider selling their shares.
5.0 Conclusion
In my Primary and Secondary research that I carried out I looked at the problem in depth and have analysed each issue of the problem in quite detail. The following were the key issues, which must be dealt with, in order for me to Proposes Solutions, which would help the business, to recover from these liquidity crises.
- After the Research I proved that Overtrading, Stockpiling and Seasonal factors were the causes of this Liquidity problems (Refer back to Section 4.5). However these are key issues that must be acted on and my solutions will be based on these.