The sums I used were: e.g.
Adding= 1a+2a or =SUM (1a:6a)
Subtracting= 2a-1a
Multiplication= 1a*2a
Division= 2a/1a
Average= AVERAGE (1a:2a)
IF…THEN function= IF(1a<2a, “dearer”, “cheaper”)
A sum from another sheet linked= (sheet1! 1a)
Plan
In my spread sheet I am planning on comparing 3 holiday, so this will mean a sheet each for them, a sheet for flights in and out, a sheet for finding containing ‘IF…THEN’ functions and more detailed information, and another sheet for graphs to show differences between the three holidays destinations. Over all there will be six sheets in my spreadsheet.
Setting up
Table Structures
Field names:
I used sensible names required for each field showing what it consists of making it easy to read and navigate.
At first I will write out my tables to show what information needs to go in each one.
This table will be on each sheet for the three holidays: Mexico, Dominican Republic and Read Sea Riviera.
Suitable Spreadsheet
From using these tools I created my former table into this table below.
Field length Column width
Titles Arithmetic functions/ formulae
I added in a picture in each sheet to show the resort in Mexico, Dominican Republic and Red sea Riviera.
Here is one of my ‘IF…THEN’ statements showing whether there is more or less sun than the UK in the holiday resorts chosen.
Row heights:
Here when I added text I had to resize the row to display all the information.
Column widths:
Here, I rotated the text of moths so it did not take up as much room.
How ever, I still had to resize the column for the whole text to be displayed.
Cell formats:
Here I highlighted the graph Next I went on the format tool
I made to be able to format it. And selected ‘cells…’
After following the steps above, the ‘formatting cells’ box appears.
Titles:
I labelled each column and row with a suitable title displaying what information it is showing. It is also arranged in boxes so it is easy to see and separate in different parts.
e.g. weather, costs, activities etc
Cell references:
This shows I have used the numerical cell references in my formulae.
In the many graphs I produced, I used lots of different formulae for example:
If/then statement:
Here is and example of my if/then functions.
It is comparing weather in the different countries against England in particular months.
Here I have created another if/then function showing the amount of rain between the four countries.
I have mainly focused on the weather as I found it the easiest to work with comparing all four countries.
Here is another if/then function displaying what flights can be caught from England airports to the three different countries.
I can prove this works because I will now change the flights from Gatwick to Birmingham to Mexico:
Enter data:
This shows all of my formulas in the grid and that they are correct as I have an answer for each one.
Predict results:
Here I tested my predictions. May 13 was costing £895 untill it was rounded up to £900, this then automatically changed May 17 to £2700 showing my formulas work.
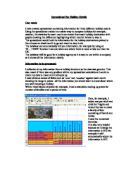
Graphs
After all the tables are made and completed by taking the steps above I made graphs and charts to show the differences between the three holiday resorts.
After following those steps you should end up with graphs like this…
I chose these graphs as I thought they showed my results the best and are easy to read.
Accuracy:
I found it hard in the beginning creating a formula from one page onto the next with out copying the information across. However, I researched it and found the solution.
I also found the if/then functions a little bit tedious, as I had to research the real facts on England’s weather and rainfall. However, I got the right results comparing the countries which worked well I thought.
I found the if/then function hard as there were two flights to the Red sea Riviera, so I had to make a new function which included and ‘and’ instead ‘or’.
Saving and backing up
Evaluation
After creating my spreadsheet, it proves how helpful they are, especially in large companies, as it is a quick and easy method to use to get data/ information.
Throughout this project I have learnt how the spreadsheet can be characterized to the company, or just to change its self from others to stand out.
Spreadsheets are used by a multiple of people to receive pacific data wanted.
I think my spread sheet works quite well, it’s useful for a travel shop and as the information I put in is genuine, I got all my information from a First Choice holiday brochure, it is ready to be in use!
If I were to improve my spreadsheet I would obviously have more destinations on there to make it a more worldwide selection.
I could add more detailed information from the travel agents such as flight times, etc.
Also from people who have visited there I could put personal comments on there guiding the next viewers on where to go/ stay/ visit etc.
Throughout the project I did come across many difficulties, for example as there were three destinations it was hard to compare them. When I was doing the ‘IF…THEN’ statement I found it hard to come up ways of using it because there were three to judge, so I hade to use an extra piece of information to work it, I used the UK’s details to compare against each of the destinations.
When I had finally finished my spread sheet I went back to check all the data was correct, as I did that I found some anomalies occurring in the ‘IF….THEN’ function, only to find it had changed the answer as I had moved tables around to fit better on the page and look neater and more presentable. It showed me it worked, but luckily I checked, or all the information would have been confused and wrong.
From my viewpoint, I think the spreadsheet works quite well, but as I said before will help when it gets more information for more detailed use for the customers.
I think colour co-ordinating the different tables worked very well, it helps section out the different parts, yet looks very presentable.
Having pictures works too, as it helps recognise the different resorts/locations to visit. It also gives an inside view of the place you would be staying in.
Although I have picked out some good point in my spreadsheet, there are also many bad too where there is room for improvement. The main disadvantage is that I haven’t got much data in the spreadsheet so in the future, will need more from the travel agent to carry on the spreadsheet to be useful and able to work in a business.
Another disadvantage is I haven’t got many graphs, although I have more than three different types, there are not many comparing between the three locations, here in the future, when I get more data, I can make more graphs/ charts that compare information to help make the customers mind up.