Growth theories:
The neo-classical growth theory (Solow 1957) states that output is a function of capital and labour, which is accumulated by investment and funded by savings. These factors are subject to diminishing returns as each additional amount of physical capital yields a smaller amount of output. Economies will therefore reach a steady state. Growth rates can only improve in the long run through changes in technology or total factor productivity (TFP).
The new growth theories focus on the quality of labour (Lucas) and the specialisation of capital produced through research and development (Romer). Increases in the quality of inputs, rather then the quantity, are vehicles for economic growth. Technological change and increases in TFP are therefore endogenous The quality of labour depends on health and education. Improvements in these can therefore lead to sustained economic growth; thus the relationship between growth and living standards is two way. However, Duffy and Papageorgiou 2000 found that the effect of human capital on income was relatively weak in developing countries and it is capital accumulation that has more significance.
Macro economic stability, the efficient allocation of resources and integration into a global economy increase the rates of return on capital and labour and attract investment enabling higher economic growth. Good governance and legal stability underpin the effectiveness these three strategies. Democracy ensures that revenues are allocated to the most needy. It has been suggested that democratic governments improve living standards directly as they give people a greater sense of freedom to use their capabilities. (A. Inkeles. 1991) Furthermore corruption hinders investment by raising transaction costs and diverts resources away from where they are most productively used. Inadequate legal systems also deter private investment if governments fail to enforce contracts and property rights.
Macroeconomic stability.
Macroeconomic stability improves the environment for investment and signals to the domestic private sector and foreign investors that the government is committed to maintaining a well managed economy. Low and predictable prices are a prerequisite for attracting foreign investment as high inflation reduces the risk adjusted rate of return. It also has an adverse impact on the welfare on those earning the minimum wage as they can buy less with their income. Graph 1 shows that inflation in SSA is as much as 12times that of the US and Asia (1988). Most recent data shows inflation is falling, but trends suggest that levels are erratic and unpredictable.
Floating, realistic exchange rates strengthen investment opportunities allowing the government to control inflation with monetary policy and reduce the risk of a speculative attack. Overvalued exchange rates result in bias against export sectors leading to a loss of output and unemployment. A balanced budget is also essential as large budget deficits crowd out private investment and discourage exports.
Efficient allocation of resources.
The efficient allocation of resources allows capital and labour to be used where it is most productive which improves growth prospects. In Africa, many nationalised industries prevent this from happening because firms can survive without needing to be productive. It is estimated that the annual rate of return on regulated industries is less then 10%. (Source: Thompson Ayodele, 2002.) Prices are likely to be higher, and goods made to a lower quality then the internationally competitive level. Inefficient allocation of resources can therefore hinder countries trade possibilities as well as wasting funds.
Long lasting conflict means that many countries (Rwanda, Sierra Leone) are allocating budget revenue to sectors that do not enhance growth. Many governments spend income on arms leaving insufficient funds for health, education and infrastructure. Health and education expenditure is necessary to improve human capital and the quality of labour. Spending on infrastructure is particularly vital for land locked countries because poor infrastructure increases cost of investing in physical capital.
Integration into a global economy.
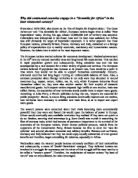
Globalisation is the interaction and integration of countries around the world. It includes the increase of trade of goods, services and information and the liberalisation of economies to maximise these benefits. The relationship between countries openness to trade and economic growth is most notable in East Asia. Malaysia has pursued outward orientated strategies, and as a result achieved average growth rates of 7.23% between 1975-1995. Sub-Saharan Africa’s share of global exports however fell from 3.7% in 1965 to 1.2% in 1998. Domestic protectionism and high tariffs on exports are largely responsible for this. Figure 4 shows tariff rates in various African economies.
Figure 4: Trends in Average tariff rates, 1980-1999 (unweighted in %)
Source: WTO database and Trade policy review, UNCTAD, Worldbank, Trade policy reform in developing countries, The Uruguay round: Statistics on Tariffs Concessions, 1996 World development indicators.
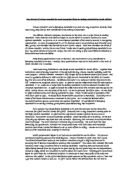
Summers 2000, estimated that Africa’s inward policies have caused an annual loss of income of approximately 20% of GDP. Sachs and Warner 1995, exemplify the popular belief that openness to trade is an important determinant to cross country growth. Rating countries as closed (0) or open (1) they found the average for developing countries is 0.37 but is only 0.04 for Africa. They found that open economies grew at approximately 2.5% more then closed economies because of the significantly higher levels of investment. Figure 5 shows foreign direct investment in developing economies.
Figure 5: Net capital flows to developing countries. ($bn annual average.)
Access to foreign savings has played a catalytic role in the growth of the newly industrialised Asian economies. Although there has been a 5fold increase in investment in less developed countries, FDI in Africa has remained significantly lower then the other regions.
Cameron, Proudman & Redding 1999 found that technical transfers from abroad contribute to long run economic growth. The rate at which technology can be imported; the proportion of foreign technology that can be adopted; and domestic growth rates without technology transfers, influence the rate of growth of TFP. Countries in SSA, which are technical followers grow at their domestic growth rates plus ‘catch up’ or the difference between their own TFP and the more technologically advanced exporters or leaders.
The Ricardian model of comparative advantage can also explain how trade is a vehicle for growth. Assuming a 2x2x1 model, the exchange of goods between countries could be mutually beneficial even if one country is more efficient in producing both commodities. If Nigeria, for example, specialises in the production of the good that it produces at a lower opportunity cost and imports the good which it produces relatively less efficiently, both countries will improve in welfare, even if the other country produces both goods at a higher cost. Balassa indices establish industries in which countries have a relative comparative advantage. Africa produces agricultural products and primary goods relatively efficiently.
Expanding on this theory the Heckscher-Ohlin proposition found that countries should export goods that require the intensive use of relatively abundant factors of production and import commodities in which factors of production are scarcer to achieve higher growth. Southern Africa has a relatively abundant supply of unskilled labour and scarce amounts of capital. Open economies should expand the intensive use of low-skilled labour. However, this does not mean that there would be any rises in demand for the least skilled labour. Although low skilled labour is advantageous, the inequality gap between the most poor and ill with the rest of the population may increase. Globalisation may indirectly raise the living standards of the most impoverished only if the governments distribute added export revenue to these people or to health and education.
Case study: Economic reform, growth and living standards in Ghana and Nigeria.
Ghana was one of the first African economies to reform in 1983. Most notably through liberalisation and exchange rate adjustment. Nigeria only attempted structural adjustment in the 1990s following two decades of stagnant growth. Although Nigeria is rich in oil, poor management of these resources and inefficiencies in investment has hindered its growth. Approximately 68% of the population are living on an income less then $1 a day (PPP adjusted current international prices.) Policy reforms have, however, resulted in a growth of output and employment in both of these countries.
Pre reforms:
Ghana and Nigeria, like many other African nations pursued inappropriate domestic policies. High inflation, an overvalued exchange rate and extensive government intervention distorted the economies and provided disincentives to save. Consequently, savings and investment were low, economic growth stagnant and in many cases falling. Graph 2 shows trends in GDP growth in Ghana and Nigeria. Before 1983, growth rates fluctuated considerably in Africa. Since 1983 Ghana has maintained consistent growth rates and Nigeria has managed to sustain positive growth since 1995. Graph 3 highlights the difference in wealth between Africa and East Asia. However, since 1983 Ghana in particular has made marked improvements.
Ghana’s economic strategy has involved progressively devaluing the exchange rate to encourage exports, removing direct controls on the market mechanism, controlling inflation and disciplined spending. Graph 4 shows the real overvaluation of exchange rates in Ghana, Nigeria and Malaysia. Between 1983-1984 Ghana’s exchange rate fell 5fold, and has since been well controlled. Nigeria is yet to stabilise its exchange rate although it seems to be improving. Graph 5 show’s inflation trends. Malaysia has sustained low inflation since 1975. Both Nigeria and Ghana have managed to reduce their inflation although levels are still relatively high and erratic.
During the 1970-1980s the government owned many of Ghana and Nigeria’s largest companies, including petroleum, transport and banking. In Nigeria in 1986 33% of the governments capital budget was invested in public enterprise. Privatisation of these has freed revenue (the governments capital budget invested in public enterprise fell to 7% in 1994) and increased opportunities for the private sector. However, removing state intervention may not always create adequate markets. For example, in Zimbabwe deregulation of the financial sector left people with more erratic access to credit then before.
Such reforms have encouraged savings and investment.
Figure 6: Trends in investment in Ghana (% of GDP)
Source: Statistical service, Accra, and IMF staff estimates
Trends in investment in Nigeria (% of GDP)
Source: Data obtained from the Nigerian authorities and IMF staff estimates.
Figure 7 shows foreign direct investment in Ghana and Nigeria:
Figure 7: Foreign direct investment inflows ( $US millions – annual average.)
Source: Data obtained from UNCTAD, FDI/TNC database.
Nigeria has traditionally benefited from higher levels of foreign investment because of opportunities from oil production. (See graph 6) Investment to Ghana didn’t improve significantly until 1992. This may be because there is a negative stigma associated with Africa of corruption, disease and low rates of return. Graph 7 shows savings as a % of GDP. In Nigeria savings are vulnerable to shocks in the price of oil although they are higher then in Ghana. However, these levels are not sufficient for Africa to achieve growth rates experienced in East Asia where savings constituted approximately 40% of GDP.
Although Ghana and Nigeria have attempted integration into the global economy, the economies have not benefited hugely from globalisation because of declining terms of trade in primary goods since the 1980s (graph 8.) Demand from industrialised countries is dominated by these products, forcing Africa to sell materials that are falling in price.
We can see that reforms have enabled both countries to attract private and foreign investment. As a result of relative macroeconomic stability (although improvements are still needed), the efficient allocation of resources and global integration, both economies have achieved sustained positive growth rates. Nigeria is possibly not as successful as Ghana because of its ungradualist approach to policy reform which generates volatility, discouraging investment.
Living standards and poverty in Ghana and Nigeria:
As discussed, growth can only have an impact on the living standards of the most poor if resources are directed towards basic health, education, social security and welfare. Expenditure on primary education will affect the poorest more so then spending on tertiary education which only benefits those able to afford it. In Ghana government spending on social welfare increased from 2.3% of GDP in 1983 to 5.8% in 1989. The poverty elasticity in Ghana is approximately –1.13 which is higher then the Africa average. However, poverty elasticities aren’t necessarily higher in countries with less income inequality. Figure 8 shows the distribution of income in Ghana, Nigeria and Malaysia. Although Malaysia has the highest poverty elasticity (-3.4) it also has the highest amount of income inequality. However, this essay only shows a very narrow view of countries, and it is likely that income inequality is much higher in Africa then many other countries.
Figure 8: Distribution of income in Ghana, Nigeria and Malaysia.
Source: World development indicators. Worldbank.
Graph 9 shows life expectancy trends in Ghana and Nigeria. From 1970-1997 life expectancy improved in all of the economies at a rate unrelated to GDP growth. In Africa life expectancy fell towards the end of the twentieth century because of HID/AIDs. This disease is not curable with any amount of economic reform and GDP growth, although education on the consequences of AIDs can help prevent the spread in the future. Similarly graph 10 shows that infant mortality rates have been falling but at a diminishing rate. Education levels have improved in these countries as seen in graphs 11 and 12 Nigeria, the poorest of the three countries has the highest level of illiteracy although primary enrolment ratios are also high. Illiteracy levels in Ghana and Nigeria are falling at constant rates even though their growth levels fluctuate. There does not seem to be any obvious changes in these trends during the countries reforms in 1983 and the early 1990s.
Conclusion:
Macro economic stability the efficient allocation of resources and integration into a global economy are important determinants of economic growth. Ghana and Nigeria who have improved their growth prospects through vigorous reforms have proved this. These policies allow countries to attract investment, which is (according to the neo-classical growth theory) the main determinant of economic growth, particularly in developing countries. Where Ghana has been successful in achieving these goals, many countries have failed, maintaining high import duties etc, which distort resources and deter investment.
Growth has the potential to be the most powerful weapon in the fight for higher living standards providing extra revenue is being directed towards health, education and other public services. The evidence to prove this is, however, ambiguous as to whether growth has direct effects on life expectancy etc. Furthermore, the concept of living standards cannot be fully covered by these basic measures. For example, although data suggests that Ghana has achieved sustained growth and improved standards of living, the level of repression and human rights violation remained unchanged. The HIV/AIDs epidemic has outweighed the effects of growth on the standards of living in many African countries.
Bibliography:
Cameroon, G., Proudman, J., Redding, S., 1999. ‘Technology transfer, R&D, Trade and Productivity growth’ CEP discussion Paper. No 425.
Griffen, R., Redding, S., 2000. ‘Mapping the two faces of research and development: Productivity growth in a panel of OECD countries.’ Institute for Fiscal Studies. Working paper. 00/02
Inkeles. A 1991 – ‘On measuring democracy: Its consequences and constraints.’ New Brunswick, N.J: Transaction Publishers.
Kapur, I., Hadjimichael, M. T., Hilbers, P., Schiff, J., Szymczak, P.1991 ‘Ghana: Adjustment and growth.’ 1983-1991. IMF Occasional Paper. Number 86.
Moser, G., Rogers, S., Van Til, R. 1997 ‘Nigeria: Experience with Structural Adjustment.’ IMF Occasional Paper. Number 148.
Moser, G., Ichida, T. 2001 ‘Economic growth and poverty reduction in Sub-Saharan Africa.’ IMF Working Papers. 01/112.
Mugabe, J., 2002 ‘The keys to Africa’s sustainable development: Sceince Technology and Investment’ Global Financial Governance Initiative (GFGI) Working group.
Summers, L.H., 2000. ‘Development and integration-Towards a new global consensus.’ UN economic and social council
Thompson Ayodele. 2002 ‘Privatisation and economic reform (In Nigeria)’ Institute of public policy analysis. Nigeria
Tsangarides, C.G., 2002 Ghura, D., Leite, C.A., ‘Is growth enough?: Macroeconomic policy and poverty reduction.’ IMF working paper. 02/118
Oxfam. 09/1997. ‘Growth with inequality: The agenda for poverty reduction’ International report.
World Development Report 2000-2001. ‘Attacking poverty.’ Worldbank.
.
Websites:
For example, a large number of landlocked countries and adverse weather conditions.
$1 a day is the official indicator of people living in poverty. This is $1 adjusted for purchasing power parity, used to provide approximations of relative buying power in different countries.
The Human Development index (HDI) has not been included as an indicator of living standards in this essay because it doesn’t differentiate between health, education and income. The ‘living standard’ components have therefore been examined separately.
According to Sen, the acquisition and use of capabilities is central to improving a persons functioning’s and enhancing human development. (See A. Sen. 1999. ‘Development as Freedom’ – Oxford University Press.)
From a selection of 46 countries between 1972-1997
Source: World development report. 2001-2002.
When the capital created through savings is equal to the amount of investment required to offset physical depreciation and workforce growth
No democratic nation has ever had a major famine. (Sen)
Source: HNP stats. Worldbank.
Closed economies defined as countries with non tariff barriers on over 40% of goods traded, average tariff rates of over 40%, black market exchange rate which depreciated by over 20% relative to the official rate, a socialist economic system, state monopoly on exports.
Griffen, Redding & Van Reenan 2000 found that countries with less technological progress grew faster then countries with a higher proportion of skilled workers because they were catching up.
2x2x1 model – two countries, producing 2 goods, using 1 factors of production. Also assuming constant returns to scale, perfect competition and thus profit maximisation where price = MC.
Source: Besa Balassa (1965-1989.)
Assuming factors of production are perfectly mobile and can move across the production of goods to equalise returns.
Source: Moser et al. 1997.
Terms of trade measured by the price of the exported good and the volume of the good produced.
Source: Moser et al. 1997.
Source: World development report. Worldbank. Using national poverty lines.
Income inequality is measured by the Gini coefficient. This is based on the Lorenz curve, a cumulative frequency curve comparing countries distribution of income with the uniform distribution. The higher the Gini coefficient, the higher the inequality.