How have the Rates of Inflation in the UK Changed Since the Monetary Policy Committee was Established in 1997?
How have the Rates of Inflation in the UK Changed Since the Monetary Policy Committee was Established in 1997?
Contents
* Introduction Page 3
* Background Page 3
* Theory Page 3 - 8
* Date Presentation, Analysis and Evaluation Page 9 - 18
* Conclusion Page 19
* Bibliography Page 20
Contents for diagrams and graphs:
* Diagram 1 Page 4
* Diagram 2 Page 4
* Diagram 3 Page 5
* Diagram 4 Page 6
* Diagram 5 Page 7
* Diagram 6 Page 7
* Diagram 7 Page 8
* Graph 1 - RPIX Inflation Page 9
* Graph 2 - RPI Inflation Page 10
* Graph 3 - British and European Union Inflation Page 11
* Graph 4 - Base Rates of Inflation in the UK since 1990 Page 11
* Graph 5 - The Economic Cycle since 1988 Page 13
* Graph 6 - Growth of Real National output and RPIX Inflation Page 13
* Graph 7 - UK Consumer Confidence Page 14
* Graph 8 - Mortgage Interest Rates and Consumption Page 15
* Graph 9 - Real Personal Disposable Income Page 15
* Graph 10 - UK Interest Rates and RPIX Inflation Page 16
How have the Rates of Inflation in the UK Changed Since the Monetary Policy Committee was Established in 1997
Introduction
In this project I will be looking at how the inflation rates have changed in the UK since 1991. Specifically I will be looking at whether the independence of the Bank of England and the introduction of the Monetary Policy Committee (MPC) has had any major effects on keeping a low and stable level of inflation within the UK. I will be looking at how inflation has been controlled, the theories around it and whether or not they have worked in practice.
Background
The MPC was first informally established in 1997, and then more formally by the Bank of England Act in 1998. The Committee's role is to deliver price stability, as defined by the government's policy on inflation, by adjusting the interest rates in the short term to either increase or decrease the population's spending power. Before the MPC was established and the Bank of England made independent the decisions on whether or not interest rates would be changed were made by the government at the time. This meant that the decisions were not always made in the best interests of the economy but to gain some short-term support for the government. This is one of the main reasons why the Bank of England was made independent. The Bank of England also decides on how much more money is going to be put into the UK economy each year. While this is not a decision that it is made by the MPC it was also changed to independent control from government, but following government guidelines, following the Bank of England Act.
Theory
Monetary policy can be used as a method to control inflation within an economy. This is usually done by the manipulation of interest rates to either increase or to decrease the spending power of the population of that economy. This is a particularly useful method to use within the UK as the majority of people own their own homes, as most of these people will have a mortgage and therefore any change in interest rates will directly affect their spending power. This can be shown in a simple example: if a family own a home where they are paying £700 a month for their mortgage while interest rates are 8%, a decrease in interest rates to 5% will mean that they are now having to pay £438 per month on their mortgage. This means that the family will have £268 less per month to spend on other goods and services. Aggregate demand is made up of all demands or expenditures in the economy at any given price, and consumption is a major part of the equation;
AD = C + I + G + (X-M)
This means that a drop in interest rates will mean that a large number of people will be able to spend a lot more money per month on other forms of expenditure.
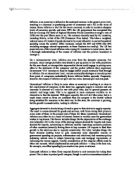
This shows how an increase in consumption will shift aggregate demand to the right and thus prices will increase from P1 to P2. This can be shown in a more detailed way by looking at Monetarist Transmission Mechanism. This shows how an increase in the money supplied via a fall in interest rates will, in the short run lead to an increase in aggregate demand.
This shows the effect that a change in interest rates could have on investment, and it has been explained about how it can affect consumer spending, this proves that it will definitely cause a shift to the right in aggregate demand. It will also have an effect on the economy by changing the exchange rate. If interest rates fall then so will the value of the pound against other currencies. This is because fewer people will want to keep the money in British banks, as they will be receiving less interest on their investments. This will reduce the number of people trying to buy pounds, which reduces its value on the exchange rate markets. This will give the UK a more competitive edge internationally, therefore increasing the amount of exported goods.
All of these things have meant that inflation will have happened in the short run. In the long run this will cause more inflation as the price rises caused by shifts in the aggregate demand line will lead to a shift in the short run aggregate supply line.
There is another theory as why there can be increases in the prices of goods and this is called the Quantity Theory of Money, this is a Monetarist theory which relates price increases to increases in the supply of money. It works through this equation:
MV=PT
This is where M stands for money supplied into the economy, V is for the speed of the money, P is the prices of goods and T is the total transactions or output of the economy. For this to work economists have made three important assumptions. These are; that V is always constant, that T is always constant and that this equation will only happen in the left to right direction, this means that an increase in money supplied will cause an increase in prices but an increase in prices wont cause an increase in the money supplied. This then shows that if the amount of money supplied to an economy is increased then prices will inevitably go up.
All of the ways that have been shown, to cause inflation, are monetarist methods, and these are under the control of the Bank of England. However there are some other possible reasons as to why inflation is caused and these are the Keynesian theories and they believe that it is changes to aggregate demand through fiscal policy, as opposed to monetary policy, that are the main causes of inflation. And these will be out of the control of Bank of England, so the introduction of an independent bank and the MPC to deal with inflation should not have made such a real difference on inflation rates. It is more the issues such as taxes and whether governments are running a surplus or a deficit on their budgets that should make the difference on inflation rates. The main emphasis is that too much money chasing too few goods causes inflation.
Pure Keynesian views are very unrealistic, as they believe that the aggregate supply line is horizontal until an economy reaches a full level of employment. This means that any increases in aggregate demand will cause inflation if the economy is operating at full employment.
Other factors that could cause this type of inflation are either wartime or post-war time conditions, as there is nearly always a shortage of goods here, a continual export surplus - where one would have lots of goods leaving the country and just money coming back in or a race for economic growth ...
This is a preview of the whole essay
Pure Keynesian views are very unrealistic, as they believe that the aggregate supply line is horizontal until an economy reaches a full level of employment. This means that any increases in aggregate demand will cause inflation if the economy is operating at full employment.
Other factors that could cause this type of inflation are either wartime or post-war time conditions, as there is nearly always a shortage of goods here, a continual export surplus - where one would have lots of goods leaving the country and just money coming back in or a race for economic growth where producing more income is not matched by the extra output. For this pure theory to be true three assumptions have to be made:
. All labour is equally efficient
2. All labour is completely mobile both in the occupational and geographic sense
3. That all capital is mobile, i.e. it can turn from the provision of one product in one part of the country to making something else in another part very quickly
This is why this is seen as an unrealistic theory, the more realistic Keynesian theory uses the same principles but not to such a strict structure. It is known as Bottleneck or Structural Rigidity Inflation.
This is more realistic as it shows that the closer an economy gets to full levels of employment more shortages start to appear in areas such as raw materials, trained and efficient labour and the production of the finished product. Companies will also encounter the problems of having to deal with labour that is unprepared to move houses or do not have the sufficient skills to do the job that is needed. This along with boosts to aggregate demand will cause inflation.
All of the theories of the causes of inflation that have been outlined so far are for demand-pull inflation. It is also possible that the inflation could have been caused by either expectation led inflation or cost-push inflation. Expectation based inflation is where the expectation that there will be inflation causes inflation to occur. This can be explained through an example; if employees expect there is going to be 10% inflation over the next year they are going to demand at least a 10% wage increase, employers give in to this and pass on the 10% in the form of a 10% price increase. This will result in 10% inflation regardless of the prevailing economic conditions. The argument against this is that this can not be the cause of inflation only a way of persisting it. If inflation has been 3% in the past then it is very unlikely that the employees will expect 10% inflation, it will only be if there have been these levels of inflation in the past. This is why some economist argue that this can not be an initiating cause to the inflation.
Cost-push inflation is another Keynesian version of inflation where it is shifts in aggregate supply, not aggregate demand, which cause the inflation.
Many different circumstances can lead to cost push inflation, the most common of these used to be wages being driven up excessive amounts by aggressive and powerful trade unions, this has not been such an issue recently due to the Thatcherite reforms in the 1980's. The cost of essential raw materials, particularly imported ones, cause cost-push inflation such as what happened in the 1970's when the price of oil rose dramatically. An increase in food prices caused by a bad harvest either in the UK or in the countries where we import most of our food. A falling exchange rate will have the same effect as other countries raising the cost of their goods, they will become more expensive. This is particularly important in a country like the UK because it relies so heavily in imports of raw materials and foods. An increase in VAT will cause a once and for all rise in prices but this can lead to a wages spiral when they go up far too far. One of the main problems with this type of inflation is that it can lead to stagflation, this is where both prices and unemployment are rising at the same time and it can cause huge problems for an economy.
Data Presentation, Analysis and Evaluation
Graph 1
From the data shown in this graph it is clear to see that since the conception of the MPC there has been price stability, and this was the primary reason as to why the MPC was established in the first place. This could therefore lead people to believe that the MPC has been successful at accomplishing its aim of keeping price inflation within the government set tolerance zone of 1.5% - 3.5%. However this data does bring into question the importance of the MPC in controlling this inflation. This is because the data also shows that the levels of RPIX inflation have been within the government tolerance since the beginning of 1993, which is when Norman Lamont, the Chancellor of the Exchequer at the time, was given the job of keeping inflation within the boundaries of 1% - 4%. He was able to achieve this without having to use an independent Bank of England.
Graph 2
This graph shows how the RPI (retail price index) has changed over the past decade and this can be compared to how the RPIX (retail price index excluding mortgage repayments) has changed over the same time period by looking at graph 1. It shows that there is not a huge amount of difference between the two, which means that changes in mortgage repayments have not changed much differently to those of other goods and services. The reason why the RPIX is used as opposed to the RPI when the MPC is looking at the countries inflation rates and the way that their policies are changing them is that the RPI would show a distorted affect. This is because, as previously explained, the manipulation of interest rates is the main method that the MPC uses to control the UK's inflation. If RPI inflation were for example 15% the MPC would want to drastically increase interest rates to cut the inflation. This would lead to the majority of the country having to pay more each month in their mortgages which would mean the RPI inflation rate would stay the same as people are simply spending their money on something different and not actually reducing the inflation rate. However if the change was made and the RPIX was being used to measure inflation then a raise in interest rates would reduce the amount of money being spent on all the goods that the RPIX measures and would therefore show a change. Some may argue that this is a way of saying that inflation is less than it really is but in fact this is not the case. As interest payments just go directly to a bank and not directly into the community there is no reason why an increase in these should cause an increase in inflation elsewhere, in fact it will cause the decrease that has been explained in the theory section. Another interesting point that can be seen in both graphs 1 and 2 is that inflation was so high in the early 1990's. It is this high inflation and the subsequent recession that followed it that is one of the reasons that the government has now placed such a priority on maintaining low levels of inflation.
Graph 3
Graph 3 is particularly important because it compares the way that inflation has changed in the UK to the way that it has changed overall within the European Union. This is very useful as the data starts prior to when the Bank of England became independent. At the start of this graph, at the beginning of 1996, both Euro zone and the UK are very close to each other in terms of their inflation, the UK around 2.8% while Euro Zone is about 2.5%. Since the inception of the MPC in 1997 until around mid 1999, Euro Zone had been keeping lower inflation figures than the UK to the point that in early 1999 they go below what our government's minimum target.
Graph 4
This graph shows how interest base rates have changed since 1990 and there is a very clear trend which shows that the base rates were falling at the beginning of the decade and then fluctuating at a far lower level for the rest of the time. Interest rates were so high at the beginning of the 1990's because of the Lawson boom. This was a period when inflation reached over 9%. It is known as the Lawson boom because Nigel Lawson was the Chancellor of the Exchequer at the time. He followed policies such as cutting tax rates and interest rates at the same time in an attempt to make the UK people wealthier but in the end he took these measures to far and just caused huge inflation levels. To counter this interest rates were raised, the result of this was a decrease in aggregate demand and an eventual lowering in the inflation figures, and how this happened has already been explained in the theory section, by diagram 1.
The early fall in the base rate will have happened as a response to the gradually falling inflation levels and the fact that the UK had now entered a recession and high interest rates will only make the recession worse. This is due to increasing numbers of people would be become unemployed and so they will have problems paying back mortgages. This effect is increased if interest rates are high as some people may already be struggling to pay back their mortgages due to them having to pay far more back a month now that interest rates were 14% as opposed to when they were 4%. It can also be explained by looking the monetarist transmission mechanism, diagram 2, the fall in interest rates will increase the amounts of money supplied. This then leads to an increase in investment which the third diagram shows will increase aggregate demand. The difference in a recession will be that the aggregate supply line will not be vertical in a recession, it will be nearer to horizontal and so look more like this;
This shows that prices will only increase a little while income increases far more which will help the economy to move out of the recession. Interest rates reached their lowest in 1994, around 5%, and then have reached that level; again in mid 1999 and the start of 2001.
Graph 4 shows what the average percentage change in real GDP, gross domestic product, has been since 1981. This is usually accepted as a measure of the economic growth of a country over the given time period. A definition of GDP is the total of all economic activity in one country, regardless of who owns the assets, the real part means that the figure take into accountant inflation.
Graph 5
This shows the same clear signs of the recession that hit the UK in the early 1990's. From the end of 1990 until half way through 1992 there was negative economic growth in the UK. From there the sudden growth from the end of 1992 up until mid 1994 can be interpreted as the usual quick recovery that comes following from a recession and has been seen before in many different economies in the world. From there there have been fluctuations from 2% to 4% up until the end of 2001. This is quite useful information for understanding the question but the next graph puts the information into greater perspective.
Graph 6
Graph 6 has shown how inflation has changed as GDP has changed. The pattern that the data suggest is that inflation is higher during times of recession or very low economic growth, and while economic growth is fluctuating at a fairly high level inflation has stayed fairly low. These are rough trends but they do follow the theory that was discussed early. In the way that when the economy is strong controlling inflation will be easier as it is possible to increase interest rates without making the lives of ordinary people very difficult and there is less need for the government to have to run up as big a PSBR, public sector borrowing requirement, as there is more income coming in from taxes and not such a need for large government spending to help the economy. It is this type of spending which causes the inflation and then the inability to control it which leads to continuing. This does not show any real differences to way the two have interacted since the MPC took over but as there have never been any real tests to the economy since then it is hard to tell the effect that they could have.
Graph 7
Graph 7 shows how consumer confidence has changed over the last four years. This can be useful because consumer confidence is measure of the consumer consumption and that is the most important part of aggregate demand. As explained in the theory section, changes in aggregate demand have large effects on the levels of inflation due to the monetarist transmission mechanism, as explained in diagram 2, so increased consumer confidence, and hence increased consumer spending should lead to increases in the inflation unless they are controlled by either government or the MPC depending on when they occurred. Graph 8 goes back a little further and shows how mortgage interest rates have changes with changes in consumer consumption. From comparing consumer confidence on graph 7 to the consumption on graph 8, after 1998, it shows there is a very similar trend between the two.
Graph 8
It is easy to see that there is a direct, and continuous, relationship between the two. Other than for a slight time lag effect interest rates have risen when consumption has been high, and then very quickly after the consumption levels have began to decrease again the interest rates have fallen. The lag time effect is because the MPC can not react instantly to changes in the market. Predicting what could happen in the market is very complicated and the best economic analyst will often get the general trends right but anything more specific will not normally be very reliable and because of this the MPC tries to react to changes after they have happened which causes the time lag effect. The same pattern is shown before and after the MPC took over control of interest rates, but the major difference is the change in levels of interest rates have been less than those exhibited before they took charge.
Graph 9
This shows how consumer spending relates to the amount of income that households generate. It is interesting to note that when inflation was at its peak during this time period, late 1980s and early 1990s, consumer spending almost matches real household income. This is important because it shows another possible different reason as to why there has been fairly low inflation since after the recession in the mid- 1990's. One argument is that the consumers have been spending less of their income because they believed that saving a larger proportion would be sensible after seeing what happened during the recession. This would indicate that interest rates were not the only really important factor in the UK's inflation performance in the last decade. However there is also the case that the high interest rates used to control inflation are the reason that consumers are spending less of their household income on disposable consumption.
Graph 10
This graph allows a more detailed comparison between how interest rates and inflation change in conjunction with each other. This compares UK interest rates to the RPIX inflation in the UK over the same time period. In 1997 at the start of 1998 the inflation levels go up slightly and this is immediately followed by a small increase in the interest rates. The fall in inflation from the beginning of 1998 until 1999 is followed by steady decrease in interest rates. It is here that an anomaly occurs from the theory because firstly inflation rises while the MPC continues to cut rates and inflation falls again, which is not what could have been expected. Then interest rates rise steadily for a few months while not a huge amount happens to inflation levels. After that it follows what the theory would suggest.
What was happening at the beginning of 1999 and the information that has been shown in graph 1 and graph 3 definitely suggest that it is not just the MPC that is affecting the inflation levels and helping to have kept the price stability from 1993. Some of the other reasons for this change are the changes that have been made both in their attitude and their methods by Conservative Party following the recession in the early 1990's. The importance of keeping inflation down and so retaining price stability has been taken far more seriously since then. The decision taken while Lamont was Chancellor to keep a balanced budget at all costs was very important and so was Ken Clarke's decision to publish the minutes of his meeting with the Bank of England when they had their monthly meetings to discuss what should happen to interest rates that month. This change made by Clarke may not seem like a very important factor but this is not the case. Prior to this the decision as to what would happen to interest rates had often been taken for political reasons as opposed to economic ones. This is because changes in interest rates could, and did, have a big effect on the popularity of the government at the time. And a cynical view to politics is that popularity is the most important thing to a politician, not whether they are doing the right thing for the country. An example of this could be how Lawson cut tax, and lowered interest rates at the same time to give people more money. This will have certainly made him very popular at the end of the 1980's but as was shown by the recession that resulted was not in the long-term best interest of the country. However it is very short sighted to say that gaining popularity was the only reason for the policies he followed. So Clarke's change made it impossible for him to try and cut interest rates to gain more support for the government if the Chairman of the Bank of England was telling him otherwise. The decision to do it anyway angered a lot of the members of his party but the data shows the effect that it had. Graph 1 shows how there, as not been a big change in interest rates between 1994 -1997 and 1997 - 2001. This asks the question as to whether the introduction of the independent MPC was really necessary.
Other factors outside of the MPC that have helped to control inflation have been the increase in globalisation, deregulation and privatisation. Globalisation has meant that trading raw materials on a world scale has suddenly become far easier which means that firms can buy the cheapest raw materials from anywhere in the world. The prime example of this is coal, the steel works in Port Talbot in South Wales run off coal, and they always used to have to use the Welsh coal brought down from the valleys, as it was the nearest, and coal is so difficult to transport. Now they use coal imported from Australia as it far cheaper, it is now cheaper to bring raw materials all the way around the world than use the ones closest to you. The increases in deregulation and privatisation have lead to far more competitive industries where companies are forced into being more efficient and keeping the price of their lower, which has helped to stop inflation. The explosion of the internet over the last decade has also lead to a far greater price transparency, which has also helped to lower prices.
The UK has had a very strong exchange rate this has curbed demand pressure for cheap foreign imports and led to lower costs of production. The supply side reforms in the 1980's and early 1990's; particularly the ones in the labour market have lower supply side costs and reduce the pressure of wage inflation. The other major factor has only become an issue in the later half of the 1990's, this is expectation inflation. In the past the expectation was that there would be inflation and that it would be fairly high, this led to expectation-based inflation. How this works is explained in the theory section. The big problem with it, other than that it causes or prolongs inflation, is that it causes difficulties for people who don't have the opportunity to have a salary increase each year and for companies that export goods. However since the late 1990's the issue of expectation based inflation has almost gone away as people now believe that there will not be high inflation rates. This is due to the work of both the MPC and the previous government.
Uncontrollable world events can also have massive effects on the economy. This can best be proved by looking at the economic repercussions following 11th September terrorist atrocities. The immediate impacts such as the crash in the stock market are not the serious issues, this is because for most industries the damage done to their stock price was only short term, within two or three months most companies share price had risen to what it was pre-September 11th. It is the more long term problems which could affect the inflation rates. Falling tourism and air travel in general effect inflation levels because they all contribute towards aggregate demand. However the real issue is that of oncoming recession, particularly in the United States where there was a real worry that the economy would fall into recession and then that would spread across the Atlantic into Europe. This would initially cause inflation to fall but the policies that government would use to fight recession would cause inflation to rise and would take inflation control out of the hands of the MPC.
The data shown about consumer confidence and consumption proves useful when connecting the theory about what was supposed to be happening with what actually was. How the changes in consumption and confidence changed with inflation supports the arguments that it is mainly changes in aggregate demand that cause inflation, as well as increases to the money supplied. This supports the argument that controlling interest rates is the best way of controlling inflation as increased interest rates have a direct effect on consumption.
The validity of the data has to be brought into question because in some cases the data may not be entirely accurate. There can be several reasons for this; miscalculations, the original data not being collected accurately, countries trying to appear to being doing better than they really are or difficulties in putting numerical values on matters such as consumer confidence. However in the case of most of the data that has been used here it can be accepted as being reliable. This is because changes in inflation rates, interest rates, average GDP changes and consumption have been taken from reliable sources such as the Bank of England and Her Majesty's Treasury websites. These sources are reliable because in countries such as Britain there are several different bodies that collect and produce this data and if the government were to try and change the figures the press would point it out and make the situation worse. The only figures can be questioned are those for consumer confidence and to a lesser extent real disposable income as confidence is a difficult issue to put a numerical value on an disposable income will vary so much over the country that some economist feel they don't prove very much.
Conclusion
The data has shown that since the MPC established in 1997 they have been able to keep a steady rate of inflation within the government's inflation targets. However there is a question as to how much of an impact that the MPC has had on this because there is an argument that, which is also shown in the data, that inflation was staying within these government boundaries before 1997 so what difference has the MPC made to inflation in the UK?
It has carried on the work that the previous government had been doing and has been very successful at it. It has also played an important role in reducing expectation-based inflation and increasing consumer confidence in the market. This is because the MPC is more trusted than the government to do what is best in the long run for keeping inflation down, not what will help them in the short-term. The MPC is probably a more professional group to decide what should happen with the inflation rate. One of the major changes is that the Chairman of the Bank of England does not exert the same amount of influence on the decision that he used to. Between 1994 and 1997 the Chancellor had to do what the Chairman wanted because otherwise he was accused of adjusting it for party political reasons. This ended up giving the Chairman a lot of power. This system is better as he does have the deciding vote if the vote is equally split but it is several experts that have an equal force on deciding what should happen. However the MPC has not had to face any major problems in the economy since they took control, there has not been a recession or any other big challenges. The big question is whether the MPC will be able to help the country out of a recession without sacrificing their role of keeping price stability. Supporters of the MPC will argue that it is having the MPC which has resulted in this lack of a serious challenge, an example being the time following September 11th up until Christmas when there were fears of an oncoming recession but the MPC reacted to stop this. While there have not been vast changes to inflation levels since the MPC took over they have carried out the job they have been asked to do well and so installing them can be described as a success.
Bibliography
The books and leaflets that I have used:
* Sloman - Essentials of Economics
* Alan Anderton
* Fact Sheet - Monetary Policy in the United Kingdom
* Fact Sheet - The Bank of England
* Bank Briefing - Inflation Report Overview - November 1998
* Inflation Report Overview - August 2001
The websites that I have used are:
* www.bankofengland.co.uk
* www.tutor2u.net
* www.bized.co.uk
* www.ons.gov.uk
* www.hm-treasury.gov.uk
Graphs
Graph 1 - Tutor 2 U website
Graph 2 - Drawn from data on government statistics site
Graph 3 - Tutor 2 U website
Graph 4 - Drawn from data on Bank of England website
Graph 5 - Drawn from data on Bank of England website
Graph 6 - Bized website
Graph 7 - Drawn from data on bized website
Graph 8 - Tutor 2 U website
Graph 9 - Tutor 2 U website
Graph 10 - Her Majesty's Treasury's website
David Benson
1