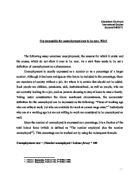
The classical demand and supply model is used to show the conditions of a labour market for a period of time. The demand curve represents aggregate demand for labour and the supply curve represent aggregate supply of labour, put together they represent the total demand and supply in the whole economy. The real average wage rate plotted on the vertical axis takes market prices into account. In other words it expresses the purchasing power.
On the diagram above the AS curve represents the number of workers, who are willing to accept jobs at certain real average wage rate and the AD curve shows the number of the labour force demanded by firms at each wage rate. The equilibrium of a labour market is at point W1 where the curve AD crosses with the curve AS. The latter shows where aggregate supply equals aggregate demand. However, if real wages rate rises above equilibrium point, it would cause excessive supply of labour, which is visibly illustrated on the diagram. With real wages at point W2 the excessive supply is illustrated by the line BC. When aggregate supply of labour exceeds aggregate demand due to rise of real wages rate, disequilibrium unemployment occurs. Real wages rate might rise due to several reasons such as when a government sets the minimum wage too high or when trade unions drive wages higher than equilibrium level. Other factors are growth in labour supply or cyclical unemployment (deficit in demand).
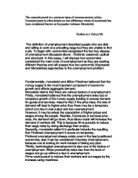
In the case with equilibrium unemployment (which is also known as natural unemployment) causes are simple. The proper definition of equilibrium unemployment is: “The difference between those who would like employment at the current wage rate and those willing and able to take a job”. That means that not every job seeker will be employed for some would wait for a better job opportunity. The following diagram illustrates the concept of equilibrium unemployment.
The curve N represents the total labour force. The distance between the N and the aggregate supply curve AS stands for the difference between people looking for work and those, who actually are willing to accept jobs at a current wage rate. Q1 is the equilibrium level of employment and the line ED is the equilibrium level of unemployment. The reason why curve N gets closer to the curve AS at higher wages is because a greater number of unemployed will be willing to accept jobs if they are offered higher wages.
The equilibrium unemployment is the main incentive why the rate of unemployment cannot be equal to zero. Moreover, if considered that there is no disequilibrium of unemployment at a specific wage level in the economy, although there are as many job opportunities as there are job seekers, there will still be a number of people unemployed just as there will still be a number of job vacancies unfilled. There could be drawn other motives for that.
First, there might be an excess demand for labor in form of job vacancies in a market and an excess supply of labor in others. The jobseekers will not be suitable to take up jobs available in the other market simply because they are not suitable (trained properly) for those jobs. Even having labor demand equal to labor supply in the same market, there might still be equilibrium unemployment, since people unemployed might be unable or unwilling to fill vacancies or be unaware of their existence.
However there is another type of equilibrium unemployment. It is the frictional unemployment, also known as search unemployment. This type of unemployment occurs when people leave their existing jobs for various reasons and become unemployed for a period of time when they are in a search for a new job. This process can be very time-consuming since those unemployed might not get the first job they apply to. The following might be caused by an employer, who keeps looking for a better qualified person for the given job. At the same time job seekers might not accept the first job offer they receive, hoping to find a better option.
The problem with frictional unemployment is that there is a lack of information. Job seekers are not fully aware of vacancies available in the market and employers are also unfamiliar of the workforce available. Therefore both parties have to search for each other. The less amount of information, the longer search for both is likely to be. Seeking takes time, in many cases more than a couple of months. The longer the average search takes, the more temporally unemployed there are going to be in the market increasing the unemployment rate.
An obvious solution to this problem would be to provide more job information through media and employment agencies. Another solution is for a government to decrease the level of unemployment benefits. This would make people more anxious to get a job; therefore they would spend less time looking for such.
The second type of equilibrium unemployment is the structural unemployment. It occurs when the structure of the economy changes. Unemployment in one industry might increase, while in another industry it might decline. There are two major reasons for this. One is a change in the pattern of demand. There are some industries undergoing a decline of demand. This can be ought to change the consumers’ choice due to the fact that the product produced has gone out of fashion. It can also be due to the pressure of competition with other industries. Another is a change in the methods of production. Examples are the rapid development of new technologies and techniques, which allow the production of the same output with fewer workforces involved. That process is called “labor-saving technical progress” and it is widely favored and used for its cost-saving advantages.
Unless the output of production increases so that it involves the spare labor force, redundancy of unused workforce is going to be the natural consequence of the technical progress. That would generate what is referred to as the technological unemployment. One more factor, which would keep the minimum rate of unemployment possible above zero, is seasonal unemployment. Seasonal unemployment occurs when the demand for labor fluctuates with the changing time of the year. That is the case in tourist regions and resorts where the demand for workforce is particularly high during the rush seasons of the year. At that time unemployment significantly increases.
To conclude, as seen above many of the causes of unemployment mostly involve factors, which are natural (such as time of the year and human character) and cannot be eliminated. Another proof of the fact that it is impossible to fight nature is that types of unemployment, such as equilibrium unemployment, will always persist in this world. Therefore it is called “the natural unemployment”, which indicates that it is natural and unavoidable to have a certain level of unemployment in the economy. Thus it is impossible for unemployment ever to be zero.
Bibliography
Hawkins, Kevin. Unemployment. Suffolk: Penguin Books, 1984.
Mankiw,Gregory Principles of Economics. 3rd Edition, 2004.
Maunder, Peter. Economics Explained. London: Collins Educational Publishers, 1995.
Parkin, Michael. Economics. N.p.: Addison-Wesley, 2003.
J. Sloman. Economics. Pretince Hall, 5th Edition 2003.
J. Sloman. Economics. Pretince Hall, 5th Edition 2003.
J. Sloman. Economics. Pretince Hall, 5th Edition 2003.