Tax Rate
“A compulsory contribution to state revenue, levied by the government on personal income and business profits or added to the cost of some goods, services, and transactions.” Oxford Dictionary
This includes just income tax. Which is a tax levied directly on personal income.
Value added Tax
A tax on the amount by which the value of an article has been increased at each stage of its production or distribution.
For example if we go out in market and buy some thing we pay some amount of tax on our purchase that is called value added tax.
The Money Supply
It means that how much government is floating cash in the economy from its stock. Governments usually increase the cash flow in order to attain the high economic growth. Because when government float cash in the market, it means that people can get the cash at low interest rates, so they can borrow in order to achieve their financial goal and this all activity results in a boast in economy.
In order to understand the results we must know what all the used symbols and abbreviations means, so here is the chart:
Chart
Before Taking Over
Before I took over economy inflation was high and was on the rate of 4.35, and whole economy’s actual production was on 446, which is less then the expected production. And unemployment was on 6.47. There was generally distrust among people on the economic performance of the previous government. So when I started the economy it was already not stable.
Year 6
So when I took over I tried to increase the economic activity and try to give it a boost by increasing the government expenditure by 2.00 and increased the money supply by 5.00. By this general production level in the country increased and exports increased from 126 to 131. Because of the increase in the economic activity, revenue for the tax also increased from 151 to 159. But this thing as a very bad effect on unemployment which increased from 6.47 to 9.17. This happen because of the inflation because as we know from the Phillip model if inflation will decrease unemployment will increase.
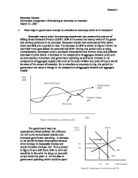
Phillips Curve
Through this diagram we can easily understand when inflation (π) increases from 0 to π1 by this unemployment decreases to U1. And when inflation decreases to π2, unemployment increases to U2. It happens here in this practical. Inflation went in minus and unemployment increases, because inflation in minus means less profits for the manufacturer, so they will reduced production and by this unemployment increased. So in my case in year 6, inflation went on –2.00 and unemployment got up at 9.17.
Year 7
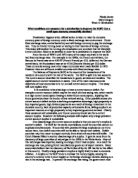
In year 7, I increase the government expenditure in order to increase the real output, because as we know for IS-LM curve analysis if we increase the government expenditure then IS curve will move upwards on right side and will find new equilibrium on LM curve and by this income and out put will increase. We can understand this from this diagram.
So in year 7 Y reached at 408. In this year I decreased the tax by –1.00in order to bring more relief for the people, so they can spend more. By this I intend to get positive inflation rate but it remained constant at –2.00. And capital flow went down to 0. And balance of payment decreased form 6 to 3. In this year I also increased the money supply by 5.00 in order to maintain the income and output. In which I got the expected positive results. But this year unemployment reached at the alarming point of 7.56. Now in next years my focus will be to decrease the unemployment, while keeping income and output positive.
I decreased tax by -1.00 by this aggregate demand went up, and actual output also increased from 441 to 463. I showed them in graph by moving equilibrium from Y to Y'.
Year 8
This year I increase the money supply by 5.00, I know this thing have bad impact on financial market, but I have to decrease the unemployment for that I increase the money supply to increase the economic activity which in turn decreases the unemployment form 7.56 to 6.16.
In this year I also increased the government expenditure by 2.00 and in order to reduce unemployment by more economic activity. This year capital flow is remained on 0. And this year real output of the economy increased to 483 whereas expected output was 484. Because of the increase in the economic activity unemployment also decrease to 6.16. This year (WGR) %change in the wage rates increase from -0.71 to -0.05. This reflects that people who suffered in the previous years are now getting better off.
From this diagram we can see that by increasing the government expenditure, aggregate demand increased from A to A' and output and income increased from Y to Y'. And this actually happened in this year. Because of this people consumption increased and producers started producing more and unemployment also decreases. But this year inflation remained in minus, so for next year my task will be to take inflation in to a positive figure in order to give another boast to the real output of the economy.
Year 9
This year I increases the government expenditure by 5.00, by this real output increased more then it was expected. This year expected output was 496, but real output goes up to 502. Inflation also went up to -1.17, unemployment decreases and reached at 5.33. But capital inflow went down on –1.00, and this is not good for the economy. For next year I have to increase the inflation with a very small ratio so that people must not get disturb and investors keep their interest in the British market. Because that in turn will decrease the unemployment which is on 5.33. So my focus for the next year will be to increase the economic activity, and to keep the incentive for the investors in the British market, and also to decrease the unemployment.
Year 10
This year I increase the government expenditure and make it 7.00 which is too much, I did this decision because my this year country’s budget is in surplus, so I thought to increase the economic activity, because this thing in turn will reduce the unemployment, which happened and it unemployment reached at 4.62, which is alright. Inflation went up to 2.27, so that investors must not lose their interest in the British market. And this year there is a sufficient increase in the wage rates, which are 6.79. And by this all economy get a boast. People started getting better off and government got success keeping the interest of investor in economy. Balance to payment went down to 5, which is not bad.
Bibliography
Books
- Diulio, Eugene A. Theory and Problems of Macroeconomic Theory. London. McGraw-Hill Publishing Company. 1974.
- Fischer, Stanley. Dornubusch, Rudiger. Macroeconomics. USA. McGraw-Hill Publishing Company. 1990.
- Glahe, Fred R. Macroeconomics Theory and Practice. USA. Harcourt Brace Jovanovich Inc. 1992.
Websites
Accesses on: 15/12/2004
Accessed on: 15/12/2004
Accessed on: 16/12/2004