I have to hypotheses:
- The River Chess will be more influenced in urban areas than rural areas. This is because more people are I contact with the river in urban areas.
- A chalk stream changes as you go downstream. This is because as you get closer to the mouth of the river it gets deeper and wider, therefore holds more water.
Below is a list of the items of equipment used to gather our information:
- Tape measure - to measure the distances
- Metre rule - to measure the depths
- Waders - so we didn’t get wet
- Rubber gloves - so we didn’t touch the water with bare hands
- Stop clock - to time the float time
- Orange - to float down the river to time
We gathered a variety of measurements, such as, the wetted perimeter and the average float time, here is a brief description of how we measured each one. To get the river width we just simply measured from the edge of the water on one side to the opposite side. To get the average depth we divided the river width by nine, and at every point, we measured from the bed to the surface with a metre rule. The cross section area was worked out by multiplying the width and the average depth. To get the average float time we measured ten metres downstream, dropped the orange in about two metres before the start mark for it to catch up speed, then we timed it from the start to finish mark three times, added them all together and divided it by three to get the average. Float velocity in measured in metres per second (m/s) and is measured by dividing distance by time. To find the wetted perimeter we placed the tape measure from one edge of the water to the opposite edge, like the width, then stood on it so it ran across the bed of the river. To find the hydraulic radius we divided the cross section area by the wetted perimeter and to find the discharge we divided the cross section area by the float velocity and it is measured in metres per second (m/s).
The whole team did their own bit into collecting the measurements, when we got to each site, one would get in the river and another would be taking down the measurements and another to time for the float time. While another member of the team was doing the environmental assessment, we then did our field sketches. Two different people would be in the river each time, so everyone got the chance to do their bit.
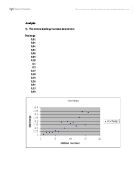
I am now going to talk about each of my graphs and explain what they show and why. Graph 1, River Width shows that Sarratt Bottom is the widest, we would expect this because as we said before, the closer you get closer to the mouth of a river it gets wider and deeper. It also shows that Latimer Park is the thinnest, this is because at this point in the river, the river splits in two, it isn’t just a miscalculation. Graph 2, Average Depth shows that Latimer Park is the deepest, here we would expect for Sarratt Bottom to be the deepest, for the same reason as above, as you get closer to the mouth the deeper and wider the river gets, but this maybe because the river is still flowing quite fast, the water is forcing a path downwards instead of outwards. It also shows that Chesham Moor is the shallowest, this is also to be expected because this is the furthest from the mouth. Graph 3, Cross Section Area shows that Sarratt Bottom has the largest area, this is to be expected because it is the widest point of the river but we would also expect the Latimer Park area to be quite big as well as a result of the river depth, it is still larger than Chesham Moor but still has an area under half of that of Sarratt Bottom. Graph 4, Average Float Time shows that Chesham Moor has the fastest float time, this is to be expected because it is furthest from the mouth so had not yet sped up to the speed to come out of the mouth, we would then expect for Sarratt Bottom to be the fastest but because at Latimer Park the river splits in two, there is now flowing faster. Graph 5, Float Velocity reflects what I said for the average float time. Graph 6, Wetted Perimeter follows the same path as the river width graph, because Sarratt Bottom is the widest, even though it is not the deepest, it has the largest wetted perimeter, and Latimer Park has the shortest wetted perimeter again because it splits in two. Graph 7, Hydraulic Radius follows the opposite route of the two it is connected with, cross section area and wetted perimeter. Graph 8, Discharge shows that Chesham Moor is the slowest and Sarratt Bottom the fastest because as before, Sarratt Bottom is closest to the mouth of the river and Chesham Moor the furthest.
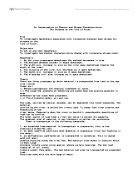
From our environmental assessment we can see that our first hypothesis is correct, they show that the river is more affected in urban areas, this is because more people are around to affect it. Our second hypothesis is also correct, most of the graphs prove this, the float time gets quicker as you got downstream and the river itself gets wider and deeper. Some of the results may be a bit out, but this could be the work of abstraction. Abstraction reduces the overall amount of water available for rivers. It can also lead to ‘localised’ loss of river flow in some places. This problem occurs around the point at which the water is drawn out of the ground. The area of low groundwater that forms around the abstraction site is called a cone of depression.
The red box above represents the pump; the long pipe running into the groundwater is the borehole. The pumps are very powerful and can pull water through the porous chalk rock.
This means that water is taken from the surrounding rock as well as from the bottom of the pipe (see red arrows). Gradually a cone of depression develops.
Chalk streams get their water from the groundwater in the rock. At point A, there will be a spring and the chalk stream will start flowing. Bt at point B, the water table is below the ground due to the effects of pumping up the groundwater. Here the stream stops flowing. Beyond the cone of depression, at point C, the water table is at surface level again and the river starts flowing again.
Abstracting water from an aquifer is an important source of our drinking water. But in some cases this can cause problems for our rivers, especially chalk streams.
At the end of this assessment I have proved my hypotheses correct, we have found out that rivers are more affected in urban areas because of people and we have found out that chalk streams change downstream, due to the speed of the flowing water. I think if we want to conserve our rivers we should act now, start protecting them from human influence.
I have really enjoyed doing this work, going out and getting the evidence ourselves instead of being handed the information and not being able to make head nor tale of it. I don’t think there would be anyway of improving my work if I did it again, but maybe getting some background information before going to the rivers. I think I spent enough time writing up my report, if we had more time, I think we would just get more chance to ramble on and we would have nothing to do in the last few days.