- Hard – can be scratched with a coin
- Medium – can be scratched with a fingernail
- Soft – crumbles in fingers
The scale was originally 1 to 5 but I decided to increase it to 1 to 10 as this would be more accurate.
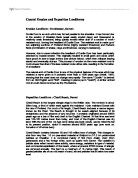
The cliff height was determined using a tape measure and a gun clinometer. These instruments enabled us to measure the angle that the cliff made with the ground and the distance from where the angle was to the base of the cliff. One person stood at the base of the cliff and pointed the gun at the top of the cliff. The disc would spin and the angle that the cliff made with the ground below was shown where the disc stopped once the trigger of the gun was pulled. Once the angle was determined a person measured the distance between the person with the gun and the cliff base with the tape measure. The distance and angle were then recorded on the results sheet.
Once we returned to the youth hostel these results enabled us to calculate the cliff height by using trigonometry.
We did these calculations using trigonometry:
Tan of an angle in a right-angled triangle is equal to the opposite length to the angle (in this case, length c) divided by the adjacent length to the angle (in this case distance d). Therefore:
Tan of angle a = length c .
Distance d
So length c = distance d x tan a
Once we had length c we could measure the height of the person who shot the gun and add it to length c to obtain the height of the cliff.
Height of cliff = height of person + length c.
We also used a measuring pole for the sand dunes at North Studland beach instead of a tape measure and a gun clinometer as they were not necessary for such a small height.
Techniques used had both advantages and disadvantages.
Advantages:
- Gun clinometer – this was light so easy to take with us to the beach and also easy and quick to use. It is a fairly cheap piece of equipment and accurate enough for what we needed it for. It also enabled us to measure the height of the cliff in a safe manner rather than having for example to get someone to climb to the top of the cliff and dangle a tape measure to someone at the bottom so they could read off the result and jot it down. This would have been impossible most of the time anyway as there were no ways to get to the top of the cliff.
- Simple scale for rock hardness – this method was quick, easy and provided simple clear results that were be easy to place on a graph but still relatively accurate. Results such as hard or fairly soft would have been unclear and impossible to plot on a graph.
- Tape measure – this was quick, accurate and easy to use with simple results to calculate the cliff height and as did the gun clinometer provides a safe way to work out the heights of the cliffs back at the hostel.
- Measuring pole – this was easy to use and provided us with the height we needed. It is also a very cheap and simple piece of equipment and wasn’t too difficult to transport to the beach. We could have used a tape measure but this would have difficult as someone would have had to stand at the top of the dune and it would have crumbled under foot as it is simply blown sand.
Disadvantages:
- Gun clinometer – the cliff top cannot always be seen and different people obtain different results. Mistakes can also be made in the calculations so the cliff heights are not completely accurate
- Simple scale for rock hardness – this isn’t very accurate as people can have different views on the hardness of the rocks.
- Tape Measure – people can measure from different points. Mistakes could also have been made if results were read off inches instead of centimetres. The wind sometimes blew the tape measures and they weren’t quite taught so the length of the distance was not as accurate as it could have been.
- Measuring pole – This was not a very accurate piece of equipment as it measures roughly what the height of the dune is. It was also difficult to plant the measuring pole at the base of the dune and get the exact height as can be noticed in P3.
Coastal landforms and features are related to the rock type (geology) of the area.
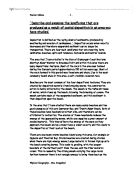
Here are the results we collected for hypothesis 1.
The harder a rock will be the more resistant it will be to weathering so generally there should be a relationship between rock hardness and cliff height. i.e.: The harder the rock the higher the cliff.
I used a bar graph to show the relationship between the hardness of different rocks and the height of the cliffs because this enabled me to see a definite downward trend showing that as the rock becomes softer the cliff height becomes smaller. I will also use a scatter graph to show this but because there are only a few results it will not be very helpful in showing a relationship between the two. I could not have used a line graph as this is not continuous data. In view of this, I think that a bar chart is the best way to show the relationship.
This shows a definite downward trend but because there are so few results it doesn’t really tell us much. With the graph just as it is if we added results for all we know the trend could be lost and this would show that there was no relationship after all. However to see if there is a relationship on a scatter graph we can use a method called spearman’s rank but on this particular graph it wouldn’t be of any use anyway as a minimum of 10 results are needed for it to be accurate. Therefore we will not be using this method on this particular graph but we will later on in hypothesis 2. Otherwise this graph clearly shows that as a rock gets softer the cliff it is made out of becomes smaller.