Tom Gilchrist Nairobi Cross Sectional Slum Survey 27th September
Comparison of Nairobi Slums, Nairobi City and Kenya population figures
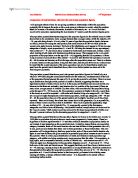
I will apologise ahead of time for not giving quantitative relationships within the population pyramids; this is because the scale on the x-axis gives no reference to exactly what the numbers stand for in terms of hundreds, thousands, hundreds of thousands, etc – so I would feel that I would not be accurately representing the true situation if I merely used the random figures given.
The population pyramid that depicts singularly the populace figures for the Nairobi slums in 2000 shows there to be consistently more younger females than younger males; which the majority of 0 – 25 year olds being female. It is only after 25 years of age that the population density balances out briefly, before favouring the male portion; this trend continues till 80+ at which point the women once again become dominant. The bulk of the inhabitants would appear to fit into two age categories of roughly equal proportions; 0 – 4 and 20 –24 being the densest for any age category. The number of 5 – 19 year olds is fairly constant for both males and females and, indeed, overall when looking at both males and females across that age group. There appears to be a very small proportion of the population over the age of 50 – 54, suggesting that the life expectancy of those living in slums is not much above this; indeed – it could be said that the life expectancy is around 40 – 44 for males and females, as this is the age where the population peters out. There is evidence of a small fraction of the population living into their later years beyond 60 however. It should also be noted that the overall structure of the slum population can only be described as erratic and, apart from the general trends described above, there is no distinct pattern as observed in the following two pyramids.