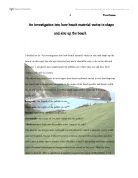
NOTE: Scree is a geographical term to describe the rock fragments which break of rocks.
There are four main processes which cause coastal erosion. These are
- Corrosion, abrasion,
- hydraulic action,
- attrition
- Corrosion, solution.
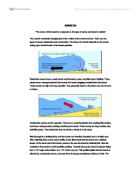
Corrasion/abrasion is when powerful waves pick up beach material (e.g. pebbles) and hurl them at the base of a cliff.
When waves hit the base of a cliff air is compressed into cracks. When the wave retreats the air rushes out of the gap. Often this causes cliff material to break away. This process is known as hydraulic action.
Attrition is when waves cause rocks and pebbles to bump into each other and break up.
Corrosion/solution is when certain types of cliff erode as a result of weak acids in the sea. The two that are likely to affect my results are Corrasion/abrasion and Attrition
Methodology
To Begin with I need some apparatus the following is what I had with me;
- Tape Measure
- Ruler
- Pen
- Pencil
- Clipboard
- Camera
The school provided me;
- Cailleux Scale of Roundness
- Powers Scale of Angularity
I will be measuring three transects throughout the day and I will do it like this:
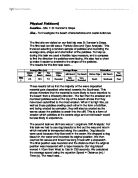
Firstly I will randomly choose transects upon the beach but I must remember to mark each transect a good idea is too make a pile of pebbles. I will then start from the cliff face of the first transect and measure each pebble about every two meters apart and I will do this roughly about 20 times I will stop when I get to the shoreline. To make it a fairer test for every two meters I step I will drop a pen top over my shoulder and which ever pebble the top has hit that will be the pebble I will use. I will measure the length of the pebble the angularity and roundness. I will use a tape measure to calculate the length of the pebble I will use the scale of angularity to measure how angular the pebbles are. I will use the Powers scale of roundness to measure the roundness of the pebbles. I will then Repeat this with the other two transect and upon another beach.
This is me measuring a pebble I will be measuring the pebble’s length (red arrow) and
with the scale of roundness. width (blue arrows) NOTE: measured longest points
Results
Results from Font-y-gary Beach.
Key Roundness 1 Being not very rounded 5 being very rounded
Key Angularity 1 being Very angular 5 being not very angular
Transect 1
Graphs For Transect 1 Font-y-gary
Transect 2
Graphs for Transect 2 Font-y-gary
Transect 3
Graphs For Transect 3 Font-y-gary
Results from Penarth Beach.
Transect 1
Graphs for Transect 1 Penarth
Transect 2
Graphs for Transect 2 Penarth
Transect 3
Graphs for Transect 3 Penarth
Analysis
My results from Penarth do support my hypothesis in every way. But my results from font-y-gary don’t. This is possibly due to the wave cut notch at this particular beach it also visible in my graphs as they should follow a pattern and they are all very irregular but they did seem to get rounder as I got to the last few meters of my transects. My graphs for Penarth defiantly follow a trend them seem to go down in a steady slop which show my hypothesis to be correct there are a few irregularities within the roundness and angularity this is possibly down to people throwing pebbles around the beach or have been moved by the see. If I were to illustrate the trends of my Penarth graphs. The pebbles do get smaller as you make your way down the beach. The pebbles do get rounder. And the pebbles are less angular
Comparing the averages of the two beaches shows that Penarth beach agrees with my Hypothesis and follows the expected pattern of the pebbles generally becoming smaller and more rounded further down the beach, whereas the results from Font-y-gary do not, and follow no trend in either their size or roundness/angularity.
Conclusion
To conclude my investigation I have summarised my findings to decide if they prove my hypothesis, “Does the size of beach material on a beach become smaller and more rounded as we get closer to the sea?”
I have come to believe that erosion at Font-y-gary beach and Penarth is mostly that of attrition but obviously other types of erosion are in action too, that of people coming to the beach and just walking over the pebbles (which is illustrated on the left, also this picture was taken a few meters a way from the entrance of Penarth beach), and also corrosion, corrosion and hydraulic action which are listed above in “what I expect to find”
Attrition is properly the most common type of erosion. As the wave has this type of power to hurl heavy pebbles at larger rocks this can cause small cracks in the rock which can now cause the rock to break down due to freeze-thaw weathering, there is also other types of weathering that could break down these rocks. Like wind action and onion skin weathering breaking down large rocks into to small thin layers that can be broken easier again. My hypothesis comes from my belief is that of, “if a pebble is closer to the see it going to be more prone to waves for a longer period of time And also attrition can happen over a longer period of time as pebble are being dragged along the bottom of the ocean while the tide is still coming in. obviously suggesting that the ocean doesn’t get that much time to erode the cliff face, as wave pounding can’t happen very long as the tide will start going back out.
It is apparent that the rocks at the cliff edge differ greatly in size to the pebbles at the shoreline which is visible as you get on the beach. It is also clear that the rocks decrease in size further down the beach. All this evidence therefore proves my hypothesis correct. This was more apparent at Penarth. There are a few things that could get in the way of my hypothesis thought
Evaluation
I believe all in all my experiment was successful even though my results from font-y-gary did not entirely prove my hypothesis correct but this is most properly due to the wave cut notch still I could of improved my experiment in a few ways. The simplest of ways is to do more transect. Another way could have been to do another beach even though I have done two. The more different ways I could of made the experiment better is I could of looked at tidal information so I could of measured more pebbles (when I arrived at font-y-gary the tide was in) as I was set to a time where I had to be home I couldn’t wait for the tide to go out.
Overall I was happy with investigation as Penarth did follow my hypothesis as you can see in my results and graphs and pie charts
Bibliography
I would like to thank the following people for they’re the following people for their information and assistance:
- David Waugh - Author of The New Wider World
- My Parents
- Ordinancesurvey.com
- Various other geography websites
- Friends
Note: I’m lead to believe a monster was moving around the pebbles at font-y-gary