Edexcel Geography B Unit 3 Coursework
AS GEOGRAPHY EDEXCEL SPECIFICATION B COURSEWORK: RIVERS
Title: During the course of the River Holford, on what scale does hydraulic radius and average depth affect the velocity downstream?
By: Curran Sareen
Centre no.: 12262
Candidate no.: 6181
Contents
Introduction 3
Methodology 7
Data Representation, Analysis and Explanation 10
Evaluation and Conclusion 20
Bibliography 23
During the course of the River Holford, on what scale does hydraulic radius and depth affect the velocity downstream?
Introduction
The aim of this investigation is to assess the relationship between several river processes which include hydraulic radius, average depth and velocity and how this changes downstream in the River Holford. This will require an accurate collection of variables using different methods and the results can be compared to real-life examples such as the Bradshaw Model and basic theory.
Location
The River Holford, a relatively small river, is situated in the Quantock Hills in West Somerset, and is approximately 7.2km long. West Somerset
Its source is located at Frog Hill and Lady's Fountain (Spring) within Holford Central Park which flows into a ford half a kilometre downstream from the source. It then flows past Woodlands Hill and the Combe Cottages 2 kilometres downstream. Half a kilometre further, it joins with another tributary (Hodder's Combe) before it flows through Holford, three kilometres from the source. For the next two kilometres it passes through a rather remote area of woodland and agricultural land until it passes Kilve, at which point, it is no longer in the National Park Boundary. The river emerges at Kilve beach and its mouths flows into the Bristol Channel.
Sketch Map
Theory - Bradshaw Model
As I progress through this project I will continually refer to the Bradshaw Model in order to compare the patterns of the variables that I've been studying. The Bradshaw Model demonstrates how river characteristics change between the upper-course and lower-course of a river, which will be relevant to my project because I can analyse and determine compare how the informationvariables that I collected compare to this model.
Key questions:
* Is there a gradual increase or decrease in the velocity downstream in the River Holford?
* Is there a gradual increase or decrease in the hydraulic radius downstream in the River Holford?
* Is there a gradual increase or decrease in the average depth downstream in the River Holford?
* Is the velocity affected by the change in hydraulic radius across the River Holford?
* Is average depth affecting the velocity at each separate interval within the River Holford?
* Is there a slight or even strong connection between the variables, depth and hydraulic radius downstream during the course of the River Holford?
Hypotheses
. There is a gradual increase in the velocity downstream in the River Holford.
2. There is a gradual increase in the hydraulic radius downstream in the River Holford.
3. There is a gradual increase in the average depth downstream in the River Holford.
4. There is a significant relationship between velocity and hydraulic radius downstream across the River Holford.
5. There is a significant relationship between average depth and velocity downstream in the River Holford.
6. There is a connection between depth and hydraulic radius downstream in the River Holford.
Methodology
When collecting data across the River Holford's course it was not possible to collect data on all the ranges of variables (because of time and money restraints) therefore it was necessary to deploy the concept of sampling.
Table 2.1
Variable
Method of collection
Description of method/variable
Justification/ relevance
Image
Disadvantages/ limitations of method
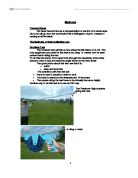
Average velocity
(m/s)
An Impeller is placed into three equally spaced out spots along the width of the channel. At each spot, we time how long it takes for the blades to reach the end of the rod. The timings are all added together and then divided by three to find an average velocity.
The impeller is a small object with a tri-fin blade screwed onto a bolt (therefore acting as a nut). It is a propeller fixed onto a nut. As the propeller rotates it moves further along the bolt. Therefore the faster the velocity, the quicker the blade will reach the end of the bolt. A rod can be attached when dealing with deeper channels
The velocity is the speed of the water flow (distance travelled per unit of time). This is relevant because the rate of water affects whether the river erodes laterally or vertically which therefore influences the shape of the river.
* At lower velocities the impeller's blade may not move and therefore there can be no measurements taken.
* Water speed can be affected by sediment and vortex effects.
* Human interference upstream affects the velocity that is recorded.
* Timing may not be correct due to delays in human response.
Average depth
(m)
A metre ruler is used to measure the depth which is the height from the water surface to the bed of the river.
The average depth of each stage in the river is measured at five different spots along the channel width. The total of these measurements was then divided by five to calculate an average depth.
Being able to see the change in depth downstream allows us to identify lateral and vertical erosion as well as deposition and transportation.
* Varies dependant on the time of year and seasons.
* Not completely accurate, usually to the nearest mm.
* Upstream, there can be many different depths at a certain channel point due to saltation load.
Average width (m)
Tape measure is used to determine the width of the channel
The width of a channel is the distance from one bank to the other. This is measured at different points across the channel to calculate and average.
The width affects the wetted perimeter and cross-sectional area and can therefore used to determine changes in channel efficiency and erosion.
* Relies on the subjective views of the surveyor.
* Difficulty of measuring width, so accuracy is always a problem.
Cross-sectional area
(m²)
Calculation
The average depth (metre ruler) x the average width (measuring tape)
Looks at the area of water at a specific channel point within a river. It can be affected by lateral and vertical erosion as well as deposition of sediment.
It's important to measure the ...
This is a preview of the whole essay
The width affects the wetted perimeter and cross-sectional area and can therefore used to determine changes in channel efficiency and erosion.
* Relies on the subjective views of the surveyor.
* Difficulty of measuring width, so accuracy is always a problem.
Cross-sectional area
(m²)
Calculation
The average depth (metre ruler) x the average width (measuring tape)
Looks at the area of water at a specific channel point within a river. It can be affected by lateral and vertical erosion as well as deposition of sediment.
It's important to measure the area of water in the river channel so that we can compare it with the velocity and also for the calculation of the hydraulic radius.
* Weak accuracy because of the lack of range with depth and width averages.
Wetted perimeter
(m)
Tape measure is submerged under the water until it is in contact with the perimeter of the channel (the bed and banks).
Usually, at least two people are required to carry out this measure. One person holds one end of the measuring tape and places it next to one of the wetted banks. Flatten the measuring tape along the bed of the river till the other wetted bank. Note: the tape should only be measuring wetted sides along the river channels.
To measure the amount of water that comes into contact with the bed. Usually at a higher wetted perimeter there is more friction but also more velocity.
* A subjective method of measuring because there may be several different interpretations to where the wetted perimeter is.
* Inaccurate method, because small potholes in the channel can be missed out.
* Relies on the depth of the river which differs throughout the year.
Hydraulic radius
Calculation
Cross-sectional area/wetted perimeter
The hydraulic radius represents the ratio between a channel's cross-sectional area and wetted perimeter.
This determines the channel efficiency at a certain course in a river and contributes to the level of velocity at that point.
* Level of accuracy of the cross-section area and wetted perimeter.
Data Representation, Analysis and Explanation
While studying different variables along the River Holford, we were split into eight equal groups. The measurements of each group were then averaged out. A table below is shown to display the results regarding the variables that are relevant to my investigation.
Table 3.1
Site
Distance from source (m)
Average width (m)
Average wetted perimeter (m)
Average depth (m)
Average velocity (m/s)
Cross sectional area (m²)
Hydraulic radius
20
0.86
0.89
0.02
0.04
0.02
0.02
2
220
.36
.59
0.07
0.07
0.10
0.06
3
480
.60
.44
0.06
0.08
0.09
0.06
4
560
.95
2.10
0.05
0.07
0.10
0.05
5
104
.75
.91
0.08
0.18
0.16
0.09
6
2987
3.23
3.37
0.07
0.17
0.23
0.07
7
4200
2.77
3.12
0.14
0.15
0.38
0.12
8
7727
3.16
3.45
0.21
0.14
0.65
0.19
In order to prove that my hypotheses are true I will compare the results in the table and analyse their correspondence between some of the variables associated with each hypothesis.
st Hypothesis: There is a gradual increase in the velocity downstream in the River Holford.
Table 3.2
SITE
2
3
4
5
6
7
8
Dist. From Source (m)
20
220
480
560
104
2987
4200
7727
Average Velocity (m/s)
0.04
0.07
0.08
0.07
0.18
0.17
0.15
0.14
This graph indicates a steady increase in velocity but represents an unusual pattern due to the fact that it increases gradually from sites 1-3 and then drops by a subtle amount after site 5, however at site 5 the velocity value more than doubles. This is expected because there was a longer distance between sites 4 and 5. The pattern of velocity does not follow the Bradshaw Model as evidenced in the graph figure 3.1. I would expect a subtle increase in velocity downstream dictated by the Bradshaw Model. The model clearly states the change in velocity is minor as compared with other criteria. In addition judging from my data analysis the smaller the value, the greater the inaccuracy in results. My findings show that the average velocity increases downstream but also shows a gradual decrease in the lower course but not that significantly.
Fig. 3.2
2nd Hypothesis: There is a gradual increase in the hydraulic radius downstream in the River Holford.
Table 3.3
SITE
2
3
4
5
6
7
8
Dist. From Source (m)
20
220
480
560
104
2987
4200
7727
Hydraulic Radius
0.02
0.06
0.06
0.05
0.09
0.07
0.12
0.19
Fig. 3.3
According to the graph and the results that it displays, there is a rather gradual increase in the hydraulic radius. I expected this, because downstream, in a river, the channel efficiency (hydraulic radius) usually increases due to the fact that cross section area is greater than the wetted perimeter as the river progresses towards the mouth. However, in the River Holford, the efficiency is rather poor which is portrayed by the results which are all significantly less than 1.00. The inefficiency is also shown in Pic. 3.1 where the depth is relatively shallow compared to the width which means that there a very high wetted perimeter. This increases friction with the water and bed resulting in low efficiency where load cannot be transported. Despite this the hydraulic radius does increase by such a subtle amount, which is due to the small-scale increases in the cross-sectional area of the River Holford downstream.
3rd Hypothesis: There is a gradual increase in the average depth downstream in the River Holford.
Table 3.4
SITE
2
3
4
5
6
7
8
Dist. From Source (m)
20
220
480
560
104
2987
4200
7727
Average Depth (m)
0.02
0.07
0.06
0.05
0.09
0.07
0.14
0.21
Fig. 3.4
The bar graph shows the gradual increase in the average depth downstream, which is expected as indicated in the Bradshaw Model. This is due to an increase in velocity and discharge which ensures that the channel bed is eroded vertically. Vertical erosion brings about large bed load but due to the small increases in these variables, rooted from the small size of the river, there is little change and range in the depth downstream.
4th Hypothesis: There is a significant relationship between velocity and hydraulic radius downstream across the River Holford.
Table 3.5
SITE
2
3
4
5
6
7
8
Average Velocity (m/s)
0.04
0.07
0.08
0.07
0.18
0.17
0.15
0.14
Hydraulic Radius
0.02
0.06
0.06
0.05
0.09
0.07
0.12
0.19
Fig. 3.5
With reference to fig. 3.5 there is correlation between velocity and hydraulic radius in the upper-course (sites 1-6) but this weakens for the remainder of the lower-course. To see whether the correlation is significant enough between the above variables, I will use the Spearman's rank test.
Table 3.6
Velocity
Hydraulic Radius
Rank (v)
Rank (HR)
d
d²
0.04
0.02
0
0
0.07
0.06
2.5
3.5
0.08
0.06
4
3.5
0.5
0.25
0.07
0.05
2.5
2
0.5
0.25
0.18
0.09
8
6
2
4
0.17
0.07
7
5
2
4
0.15
0.12
6
7
0.14
0.19
5
8
3
9
?d² = 19.5
Substitute into equation
P = 1 - (6 x 19.5)/8(64-1)
P = 0.77
Fig. 3.6
The graph above indicates how significant the correlation level is between velocity and hydraulic radius which falls at a degree of freedom at 6.8%, indicating a relatively low correlation between the two variables. This occurred as average velocity varied in the lower course of the river and was therefore unable to match the pattern of the hydraulic radius. Although the river became more efficient towards the lower stages of the River Holford, the velocity did not increase which was surprising as this is a basic model for most rivers.
5th Hypothesis: There is a significant relationship between average depth and velocity downstream in the River Holford.
Table 3.7
SITE
2
3
4
5
6
7
8
Average Velocity (m/s)
0.04
0.07
0.08
0.07
0.18
0.17
0.15
0.14
Average Depth (m)
0.02
0.07
0.06
0.05
0.09
0.07
0.14
0.21
Fig.3.7
In ways, these two variables are well correlated because if velocity increases then that means that the river bed will be eroded more effectively due to the increase in energy available. This increases the depth in the channel, and if the depth increases downstream, it is likely that water can move more rapidly due to the likelihood of a steeper gradient. I deduce that the correlation between these two sets of data is not strong enough due to the fact that velocity doesn't follow a simple pattern in my investigation (especially in the latter stages) so it is hard to relate velocity to average depth.
To see whether the correlation is significant enough between the above variables, I will use the Spearman's rank.
Table 3.8
Average depth
Velocity
Rank (d)
Rank (v)
D
D2
0.02
0.04
0
0
0.07
0.07
4.5
2.5
2
4
0.06
0.08
3
4
0.05
0.07
2
2.5
0.5
0.25
0.08
0.18
6
8
2
4
0.07
0.17
4.5
7
2.5
6.25
0.14
0.15
7
6
0.21
0.14
8
5
3
9
?d² = 25.5
Substitute into equation
P = 1 - (6 x 25.5)/8(64-1)
P = 0.70
Fig. 3.8
Taking the readings off fig.3.8 the degrees of freedom is 8% and so the reliability is only 92%. This signifies poor correlation. There is no significant relationship between average depth and velocity downstream in the River Holford. This doesn't come as a surprise because according to the Bradshaw Model, velocity has a small and gradual increase unlike average depth which has a bigger increase downstream a river.
6th Hypothesis: There is a connection between depth and hydraulic radius downstream in the River Holford.
Table 3.9
SITE
2
3
4
5
6
7
8
Av. Depth (m)
0.02
0.07
0.06
0.05
0.09
0.07
0.14
0.21
Hydraulic Rad.
0.02
0.06
0.06
0.05
0.09
0.07
0.12
0.19
Fig. 3.9
From the graph (fig. 3.9) a strong relationship can be seen of the two variables.
To see whether the correlation is significant enough between the above variables, I will use the Spearman's rank.
Table 3.10
Average depth
Hydraulic Radius
Rank (d)
Rank (HR)
d
d2
0.02
0.02
0
0
0.07
0.06
4.5
3.5
0.06
0.06
3
3.5
0.5
0.25
0.05
0.05
2
2
0
0
0.08
0.09
6
6
0
0
0.07
0.07
4.5
5
0.5
0.25
0.14
0.12
7
7
0
0
0.21
0.19
8
8
0
0
?d² = 1.5
Substitute into equation
P = 1 - (6 x 1.5)/8(64-1)
P = 0.98
From this value I can already see the high level of correlation between average depth and hydraulic radius as it's incredibly close to 1 (being perfect correlation). However, the 'Spearman's rank significance graph' below will show how accurate the correlation really is.
Fig. 3.10
The degrees of freedom reads just under 3% which shows strong and positive correlation between the two variables (average depth and hydraulic radius). The significance level is 98%, proving correspondence between the variables. This result is expected as the average depth is proportional to the hydraulic radius (HR=A/WP).
Table 3.11
Hyp.
Analysis
Explanation
There is a jump in velocity of 0.075 m/s to 0.175 between sites 4 and 5 relative to the river course.
This has occurred due to the reduction of the wetted perimeter at site 5 whilst its cross sectional area increased due the channel's increase in depth. This meant the hydraulic radius increased leading to a more efficient channel because of a reduction in friction at the riverbanks and the bed. In addition the distance between 1,2 and 3 is small when compared with 4,5 and 6. This would mean a larger increase in velocity evidenced by my results and illustrated in the graphs (fig 3.1 and 3.2).
2
Hydraulic radius increased by 850% between site 1 and 8
Hydraulic radius increased by such a substantial amount due to the extremely small and inefficient channel at the source of the river. The river gradually matured and its cross-sectional area began to increase at a higher rate than wetted perimeter towards the latter stages of the river.
3
Depth increased by 50% from site 7 to site 8.
The depth increased the most in the lower-course much more because of greater channel efficiency downstream (greater hydraulic radius), which meant that that the riverbed was eroded more effectively.
4
There was only a relationship between velocity and hydraulic radius in the upper course.
May have occurred due to: less interference from other groups in the upper stages; difference in gradient along the river (gradient change was more significant in the upper-course); precipitation may have affected a range of velocities downstream. There was no relationship in lower-course of the river as hydraulic radius continued to rise whereas velocity decreased slightly.
5
The correlation between velocity and depth weakened downstream
In the upper course depth had a stronger relationship with velocity because both of these variables increased sharply. However, velocity failed to increase beyond site 5 whereas depth gradually increased towards the end of the River Holford's course.
6
The values and pattern of the hydraulic radius was very similar to that of the average depth.
The value of the hydraulic radius depends on the depth as this affects the cross-sectional area and wetted perimeter, which together determine the value of the hydraulic radius.
Equation - HR = Cross-sectional area/Wetted perimeter
Hypotheses
. There is a gradual increase in the velocity downstream in the River Holford.
- There was not much of a gradual increase in velocity downstream the River Holford partly due to the dramatic jump in velocity from site 4 to 5. It definitely didn't follow a regular pattern like it was meant to but it did show small gradual increases in the upper stages which was what the Bradshaw Model projected. However, it decreased insignificantly in lower stages.
2. There is a gradual increase in the hydraulic radius downstream in the River Holford.
-There was a very strong correlation between the hydraulic radius and the location downstream in the River Holford. This came as no surprise because downstream a river becomes more efficient because a lower proportion of the water is in contact with the bed and banks (wetted perimeter) compared to the cross-sectional area of the channel.
3. There is a gradual increase in the average depth downstream in the River Holford.
- I believe that there was quite a reasonably good correlation between the average depth and the location downstream. The correlation of average depth downstream was very similar to the correlation of the hydraulic radius downstream which came I expected because average depth plays a role in calculating the hydraulic radius. The correlation fairly followed the Bradshaw Model.
4. There is a significant relationship between velocity and hydraulic radius downstream across the River Holford.
- The relationship between these two variables was moderately strong and I believe that there is a link between the two. But, on the other hand, I believe this can be said only for sites 1-4 as the latter stages in the river don't portray a strong enough direction in pattern. I believe that the velocity is fairly affected by the value of the hydraulic radius during the course of the River Holford. However, I carried out the Spearman's Rank test to measure how significant the correlation between the two variables were. I calculated that the significance level was 93.3% which is lower than the required percentage (95%) so I accepted my null hypothesis.
5. There is a significant relationship between average depth and velocity downstream in the River Holford.
- I wasn't able to see much correlation between these two variables and I think it was the unusual pattern in the velocity which led to the weak correlation with average depth. To prove this, I used Spearman's ranking and calculated a significance level of just 92% which was lower than the required 95%. I had to accept my null hypothesis.
6. There is a connection between depth and hydraulic radius downstream in the River Holford.
- By looking at the graph I could see a set of strong related variables, average depth and hydraulic radius, which didn't come as a surprise as average depth does play a role in the calculation of hydraulic radius. To prove that I was certain of the correlation between these two variables, I carried out Spearman's ranking. The significance level was worked out at 97%, which was quite high compared to the results of my other hypotheses. My null hypothesis was rejected. It was good to see that some variables, such as these, can show a good level of correlation, which relates to theory.
Evaluation and Conclusion
During my investigation I have identified several limitations and reasons to why I have achieved some results, which have influenced whether I can accept or reject my hypotheses. Now that the data has been analysed I can draw conclusions to the key questions raised in this investigation.
The connectivity between hydraulic radius and depth on velocity appeared to be rather insignificant, hence the correlation rankings of 0.77 and 0.70, despite the bonds between the variables in the upper-stages of the River Holford. There was also a strong relationship between hydraulic radius and depth demonstrated by fig. 3.9 and proved using fig. 3.10.
Table 4.1
Hypothesis
Conclusion
Evaluation of strength of conclusion
- rejected
The velocity does not gradually increase downstream in the River Holford.
This is quite a weak conclusion because as there is not a solid explanation for the unexpected decrease in the velocity in the lower course and the increase in the velocity in the upper stages.
2 - accepted
The hydraulic radius increases gradually through the course of the River Holford.
This is a strong point as it can be explained using the linked variables, channel width and depth, and the magnitude of their changes downstream (ref. to Bradshaw Model). Width increases more than depth which means that cross sectional area increases more than wetted perimeter downstream resulting in a more efficient channel.
3 - accepted
Downstream, the average depth increases at gradual rate.
This is a rather fine conclusion as it can be explained with similarly compared to the Bradshaw Model and vertical erosion.
4 - rejected
There is no correlation between velocity and hydraulic radius downstream.
In some ways this is quite a strong conclusion as the use of Spearman's rank determined this however, the strong correlation is not taken into account in the upper-course which reduces the potency of the conclusion.
5 - rejected
There is no significant relationship between average depth and velocity
The relationship between these two variables is even less significant despite the signs of good correlation in the upper-course. This demonstrates a good conclusion point which is proven through the use of Spearman's rank.
6 - accepted
There is a connection between depth and hydraulic radius downstream in the River Holford.
This is a very strong conclusion point proven by the strength of the testing using Spearman's rank. Using the hydraulic radius formula it is obvious to see why they are linked in the River Holford.
The various hypotheses set in this project have been either accepted or rejected as indicated above in table 4.1. The decision of accepting or rejecting the hypotheses are determined by the use of tables, graphs, photos and techniques (in the last three).
The Spearman's ranking has allowed me to assess the level of correlation between hydraulic radius and average depth on velocity. The hydraulic radius and average depth connection with velocity was both rejected. However, the significance levels for both hypotheses were 93.3% and 92% which was rather short of the required level (95%). The strength of the correlation was dented by an inconsistent set of results for average velocity but had we spent more time studying the River Holford, I believe a more positive set of results would have been produced. Thus, I conclude that there is a medium strength of correlation with both hydraulic radius and average depth on the velocity of the River Holford downstream.
SWOT analysis
Fig. 4.2
Strengths
Weaknesses/limitations
An accurate collection of data was obtained from each stage as measurements were repeated as many times as possible.
The upper stage of the river sites were all clustered together which meant that there was little difference between the early sites meaning that some variables didn't follow the Bradshaw Model.
The measurement methods that were applied across the different stages in the River Holford's course weren't rushed so they can be considered as fairly accurate. This included the use of several digital devices such as the timer.
The antecedent conditions would obviously play a massive role in the variables studied due to the amount of water currently flowing in the river. Dependant on the weather and the time of year
Working in small groups of three ensured that measurements were fairly judged and therefore reduced bias.
As data was collected by a variety of different people, data that relied on semi-subjective views such as wetted perimeter could be biased.
Opportunities for improvement
Threats for improvement
A longer period of time could be spent studying the River Holford so that there was a constant spacing between samples and sites.
Time and money constraints would not allow us to spend more time studying further sites. More sites would require a lot of people.
The problem of subjective views could be solved by allocating a group to collect such data which could be compared amongst the members.
This would result in a lot of walking between sites for the group which would take a lot of time and effort. Students would be unwilling to do this.
To overcome the influence of antecedent conditions, the river variables could have been recorded on a wet day and a dry day.
The weather may be capricious and therefore it may take longer to collect results and students may not be prepared for lengthy collection of data.
Throughout the investigation a large quantity of variables were studied and analysed which allowed many tests for linkages between some of these.
Other avenues of enquiry could involve looking at vegetation interference with the river's bed and banks as many leaves and rotting branches were deposited around the river's channel. Also, the frequency of specific river features could have been mentioned to demonstrate real-life examples drawn from theory. Transportation and depositional problems could also have been brought into the investigation during the field trip.
Overall, the investigation was completed to a satisfactory level with respectable results although some contradicted the models of a river's variables. It was completed on time and many students benefited from the experience and teachings.
Bibliography
www.multimap.com - Local and national maps within the Introduction
www.geographyalltheway.com - Bradshaw Model
www.geographyfieldwork.com - Spearman's rank coefficient graph representation
http://www.exmoor-nationalpark.gov.uk/ - Maps and information about the area
Word count - approx. 2260
Curran Sareen AS Edexcel B Geography Coursework
1