Where (h1-h2) is the deference in the levels in manometer limbs 1 and 2
Now apply continuity equation (1) to obtain the theoretical discharge as
(4)
As A1, A2 and g are constants then the discharge Q is directly proportional to in practice Q is slightly less than that given theoretically by equation (4), the difference being accounted for by the discharge coefficient, Cd, of the meter (Cd is typically in the range 0.95 to 0.99) so that
Q(act) = Cd . . (5)
The total head (energy) loss through the meter is given by
hL = (h3 – h1) = K./2g thus K= (6)
(Where K is the energy loss coefficient for the meter)
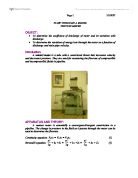
PROCEDURE:
The axis of the meter was checked if horizontal (then Z is constant).
The air pressure in the manifold was adjusted, so that at maximum flow the difference in levels of piezometers 1 and 2(i.e. upstream and throat) is at approximately the maximum readable value.
With the flow set at this maximum rate the levels in piezometer 1,2 and 3 were noted ,and simultaneously the actual rate of flow (Q(act)) was recorded by collection of a know volume in the under-bench weighting tank: each weighting was repeated until two consistent time were recorded.
For a series of different flow rates Q, piezmeter levels h1, h2 h3 and the actual flowrate was recorded.
Flow was altered by adjusting the valve downstream of the meter- steps of 20mm rise in the h2(throat) reading are usually suitable until the value of (h1-h2) was about 60 mm ,then raise h2 in steps of about 10mm or 5mm until (h1-h2) is nearly zero.
RESULT:
Experimental results:
Table (1)
Table (1)
CALCULATION:
Worked example: (I used in these examples the first run)
Note: volume collected on each run = 7.5 liters = 7.5 * 10-3
-
Q= volume collected / time taken= m3s-1
Q= =4.58E-04 m3s-1
By re-arranging equation (5):
Cd=
Where = 1061.7596
Therefore Cd=1061.7596 * = 0.994430903
Where A1=
Therefore V1=
V1= 1973.525 * 4.58E-04=9.04E-01
K==9.13E-01
DISCUSION OF RESULT:
1) What dose Cd allow for? Is it constant? If not then why not?
The actual flow rate through the meter is seldom equal to the theoretical flow and usually turns out to be less than the theoretical flow. In order to account for this difference, a discharge coefficient Cd is introduced into the flow equation.
Cd is not constant because it depends on the Reynolds Number and the ratio of nozzle to pipe diameter.
2) What are the sources of energy loss in the meter?
- Friction that caused by turbulence flow inside the meter
- Pressure effects.
3) When velocity is increase the pressure will decrease, and that will reduce the pressure effect which it source of energy loss, it will be a constant and vaule will be between 0.5 and 1.
When I compared the graphs which I got with the lab sheet graphs I found that:
Graph (1): the graph was similar to the one in the lab sheet.
Graph (2): the graph was completely different to the lab sheets graph, that difference can be happened because of the accuracy of the reading.
Graph (3): the graph was slightly different from the one which is in the lab sheet.
The values of Cd which I got it was right because it was between 0.95 and 0.99 except two readings.
BIBLIOGRAPHY:
Laboratory worksheet
http://www.eng-software.com/kb/db/files/1322/kb1322-Flow%20Meter%20Sizing.pdf