4. How do coastal defences work?
To answer this question I will quite simply make a list of the different forms of coastal defences and then describe how each one works. I will mainly be using my pictures and annotating them, pointing out where the sea defences are and then I will write in the text how they work.
I chose this question because it explains why different defences are used and why.
5. How effective are the coastal defences in place?
In this question I will again describe how the sea defences work and I will make a few examples of how effective they are on these beaches.
I chose this question because it describes the defences in more detail.
In this project I will be using primary data (I have collected myself) and
Data Collection
Methods of data Collection
1) Beach profiles.
To collect the beach profiles:
- I held a metre rule upright at the shoreline, then placed a second metre rule 10 metres further up the beach or where there was an obvious change in the beach slope. I recorded the distance between the metre rules.
- Then I measured the gradient of the beach by using a clinometer, placing it on the top of the higher metre rule and then lining it up with the top of the second metre rule. I then very carefully recorded the angle in degrees.
- I did this until I ran out of beach.
We measured the beach profile to find the shape of the beach. It allows me to compare the beaches to find how much erosion there is in North Norfolk. It also shows us whether or not the beaches are constructive or destructive beaches, and how well they are protected.
Weybourne
Sheringham
Cromer
Overstrand
2) Sediment Analysis.
To collect the Sediment data:
- I collected 14 pieces of sediment (stones/pebbles) and discarded the 2 largest and the 2 smallest pieces, then I recorded the length by measuring the longest side of the pieces of sediment,
- Then the roundness of the pieces was recorded (comparing them to the chard on the handout) on a scale of 1 to 6.
I collected the sediment analysis to find how destructive the waves on the beach are. It allows me to compare the beaches to find how much erosion there is in North Norfolk. It also shows us how well the beaches are protected.
Weybourne
Sheringham
Cromer
Overstrand
3) Groyne Measurement.
To Collect the Groyne Measurements:
- I measured the height of both sides of the Groyne at 10 metre intervals starting from the top of the beach to the shoreline using a metre tape.
I measured the Groynes to find the differences between the two sides and to quite simply see how long they were. We could then compare this to all the other beaches to get an overall view on the extent of the defences used.
Sheringham
Cromer
Overstrand
4) Longshore Drift.
To measure the Longshore drift.
- I measured 20 metres along the shoreline and threw an orange midway between the points and timed how long it took the orange to travel 10 metres in any direction and then I recorded the direction and time taken.
I measured the Longshore drift because this information is helpful when working out which beaches are constructive and destructive.
Weybourne
Sheringham
Cromer
Overstrand
5) Infiltration Rates.
To Measure the infiltration rate:
- I placed a plastic tube in the ground about 2 inches into the ground. Then I poured water into the can and recorded the length of time it took to filter into the ground We recorded the results.
I measured the infiltration rates because this is a good method to see how much water will be able pull the sand back to sea.
Weybourne
Sheringham
Cromer
Overstrand
We completed an environmental quality index questionnaire for each beach, where we marked the beach on different aspects on a scale of 1 to 10.
We also drew a field sketch of each beach visited.
6) Limitations.
1- Obviously the beach profiles are not going to be amazingly precise because we had to do large amounts of measurements in a short amount of time so we could only measure every 10 metres or more, and the diagrams are in straight lines, therefore the overall beach profile will be
2- Some beaches were entirely sand, therefore this measurement was obsolete.
3- Some Groynes went far into the sea, so therefore it would be dangerous to measure all of it. While not all the beaches had Groynes.
4- The orange may go out to sea therefore it is difficult to see whether it has gone further than 10 metres (causing results not to be entirely accurate).
5- The beaches which consist of sand did not filtrate, while other beaches with pebbles infiltrated faster than we could pour in the water. This was therefore a very inconvenient test to do since there are not many beaches where we could get satisfactory results.
Data Presentation
Analysis
Analysis
Weybourne
My beach profile and graph for Weybourne show that the beach has platforms of varying length yet the same angle throughout each level. The beach rapidly increases at an angle of 17° for 2.85 metres then for 1.44 metres it extends at an angle of 14° and so on. The beach decreases in size slowly every year but the pebbles are replaced at the beginning of each year, destructive waves and nature of erosion are why a defence is required at this beach. This is an example of dumping, a man made defence.
The pebble size decreases as you move away from the sea at low tide. This happens because this beach is constructive when the defence is in place, but larger pebbles can not be transported as far as smaller pebbles which is why they are larger at the sea and vice versa. Size is also increased because the man made pebbles are quite large to prevent them from easily being transported by the sea.
The pebble roundness increases as you progress up the beach because the larger stones at the sea are not moved therefore are not eroded by the waves, smashing the rocks together causing them to chip off bits. The nearer you are to the water the less the roundness because the rocks are not moved therefore are more like barriers.
Weybourne’s longshore drift is very slow and travels east. It took over 2 minutes for it to travel 10 metres in said direction. But the infiltration rates were fast because it was a rock beach therefore the water drained before we were able to pour it (almost).
Sheringham
My beach profile and graph for Sheringham show that the beach slowly increases at an angle of 5° and then at 25 meters the angle suddenly increases at a steeper slope. The beach angle suddenly increases and there is a man made defence of pebbles and rip rap; humans deposited the material. Also destructive waves will be taking place on this beach.
As you move up the beach the sediment increases in size. This is because at the middle of the beach and the sea wall there is dumping and rip rap. Therefore there is man made defences. Also this is because there is stronger erosion near the sea as there is more power from the waves braking onto the beach.
The sediments roundness for the middle beach and the seawall was very rounded for the middle area but the cliff had some less rounder rocks.
The sea part of the beach is sand, therefore there was no infiltration but the rocks for the middle and seawall were obviously fast.
The Longshore drift for Sheringham beach was relatively long and went west it took 1 minute 34 seconds to travel 10 metres which is very slow even though this is a destructive beach, at low tide the strength of the waves or speed is not particularly impressive.
Cromer
My beach profile for Cromer was very flat and no radical changes in the slope.
The size of the stones on the beaches of Cromer get larger as you further up the beach.
The roundness of the stones on the beach of Cromer are completely random throughout the beach.
The Longshore drift is very fast, 28 second for the orange to travel 10 metres.
The infiltration rates were fast also.
Overstrand
My beach profile for Overstrand was pretty much flat because this is a very destructive beach. There is a lot of defence on the beaches of Overstrand but the beaches which are left are completely wiped clean by the waves.
The was no stones on this beach, so the size and roundness could not be measured.
The groynes were mainly the same length on both sides but they extended a good 50 metres into the sea which we obviously couldn’t measure.
The infiltration rates are very long, we thought that sand would not infiltrate the water but we were wrong it took about 2 to 3 minutes to infiltrate.
The Longshore drift was quite fast, I took just over 1 and a half minutes for the orange to travel 10 metres in a westward direction.
Conclusion
Conclusion
1. How do beach profiles vary?
Weybourne beach has no visible defence because you could not tell that there was dumping with out it being pointed out. The dumping itself is relatively unsightly in my opinion because it is very plain and just rocks. But this form of defence (dumping) is very effective. The infiltration rates are very fast since it is a rock beach. This beach is obviously been made a constructive beach by the dumping but this still has to be replaced annually.
Sheringham beach is a destructive beach because between the sea wall, rip rap and dumping on the cliff side and the sea on the shoreline, there is a 25 metre expanse of sand where the waves have pulled everything off the beach. The infiltration rates for the sand was N/A therefore it is obvious that this beach is destructive.
Cromer beach is a on a relatively flat slope beach with groynes, and dumping. It have a range of different sized rocks all over the beach but from the results it is obvious that this beach is a destructive beach mainly large stones are left at the top of the beach but smaller ones are lower to the shoreline, this suggests dumping.
Overstrand beach is a completely flat beach with a lot of sea defences. It has large groynes that extend far into the sea, the it has gabions and revetments and large amounts of dumping. This beach is entirely sand and very unsightly in my opinion. This beach is destructive.
I conclude that the beaches vary from the way the sea defences are used.
2. Why do beach profiles vary?
Weybourne - a destructive but dumping has made it a constructive
Sheringham - a destructive
Cromer - a destructive
Overstrand - a destructive
These beaches are mainly destructive because the waves have a long way that they travel without resistance and because of this the waves are very strong and they wipe the beaches of all loose rocks therefore can be very erosive. Sea defences help prevent a destructive beach destroy the effects of these waves.
The sea defences are used in many ways as you can see from the pictures in question four.
The different defences used on the four beaches in North Norfolk I visited were:
- Groynes
- Revetments
- Seawalls
- Rip Rap
- Gabions
- Beach nourishment (Dumping)
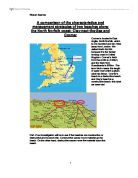
3. Do coastal defences alter the characteristics of the beaches of North Norfolk?
The characteristics of the beaches of North Norfolk vary according to the different forms of coastal defences used. They can be very unsightly if there are groynes or rip rap but if there are beach nourishments then this can improve the look of the beach.
Weybourne - attractive
Sheringham - unsightly
Cromer - quite unsightly
Overstrand - very unsightly
The groynes are large structures of wood or scrap metal and make a beach look messy, they are unsightly and not particularly effective. They alter the beaches look completely and may detract from tourism.
The beach replenishing is very effective and not unsightly if the right sediment is used. This form of natural defence is effective and would not detract from tourism.
Vertical sea walls are very effective but completely change the characteristics of a beach. This wouldn’t detract from tourism but I would give the beach a completely new profile.
4. How do coastal defences work?
Please see annotated photographs attached.
5. How effective are the coastal defences in place?
Please see annotated photographs attached.