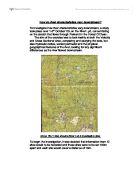
Moving on to the major point, where the river is located. The Lung Hang River is located in the area of the Sai Kung Country Park. The country park itself consists of 2 parks they are the Sai Kung East and Sai Kung West this includes the Wan Tsai Extension.
There is a significant importance in studying rivers characteristics this is because with the information which is gathered from the research we are able to solve geographical problems. Moreover when we study rivers characteristics there could be chances of us taking advantage of them. For example, major steps have been taken to help Hong Kong’s high water demand by using the Dongjiang River. By studying a rivers characteristics we are able to predict its possible months or dates which then river may flood in. this is significantly useful due to the fact that it my save lives and money. Furthermore more by studying the river we will be able to find out what pollutants are damaging the river and take actions so that a river will be safe from contamination. By studying more in depth of the river there could be also chances of developing around the area of a river. In result of this there will be a good economic turnout, moreover from this point; there will most probably be a very good positive out come from these developments. Studying the river can also determine weather or not erosion would be a factor in terms of safety. Studies can also help by establish factors which may concern the erosion of the river. By finding this out we will be able to predict the changes. The knowledge that the river may erode could also be important to safety issues.
Chapter 2 methodology
During the trip to the Sai Kung Country Park, where we went to investigate about how and why do the characteristics and processes of a river and its valley, vary the channel and downstream using the Lung Hang River we used various types of data collection to up hold the information we needed.
Photography and sketching of maps
Photography is a very important aspect of data collecting. Due to the fact that they give detailed analysis of the area which you may not remember to every single detail photography can also help your later stages of sketching and making of the cross sectional area. Overall photography helps to “save” the condition that the area you visited for later references. This form of data collection was performed by using a still frame camera for photography and pencil and paper for the stretching. Normally we focus on a point and either take a picture of it or sketch down what it looked liked
Stream velocity of a river
Due to the importance of understanding the velocity of the stream this from of data collection is a must. When finding the velocity of the stream it helps us to comprehend how much energy the river has. The bed load will also be identified at this point. The size of the bedload will also be found helping us understand how powerful the traction and saltation is in the river. This will further more help us find out the erosion power of the hydraulic action in the water of the river which then concludes how the river shapes the land. How we found the velocity was by setting up an area which a ping-pong ball travel between and calculating the time it took. The area was produced b 2 ranging poles set 10 meters apart which was set upstream. Actions then taken were the time which the ping pong ball took to travel from one end to the other end. Furthermore we did this in 3 different positions which consisted of left, center and right bank of the stream.
Stream discharge of a river
The stream discharge is again an import aspect of data collecting its narrates how much water the river is able to carry at a certain point. This is measured in cubic meters per second. The relationship between the cross sectional area of the actual river and the cross sectional shape of the river channel can tell us what the weather has been like for the past few days. We found the stream discharge by multiplying stream velocity by the cross sectional area.
The formula is …
Stream velocity X cross-sectional area
Averages are then taken of
The average time of float tests. This is found by dividing the results which are added up by 3. They are then multiplied by 0.85 because this is the speed of the water on the surface. Finally the average velocity in meters/second is recorded by divined 10 meters by the time in the centre stream.
Load of the river
But finding out the rivers bedload we will be able to have an idea on how much energy the river has. Larger jagged and uneven rocks are normally found in the upper course. In the middle and lower course they are significantly smaller and smoother. However during floods this flow is totally difference as the river is more powerful, larger rocks can be found further down stream. The size of the bed load also gives us ideas about the erosive properties of a river. The larger the partial that is carried by the traction the more erosion it will do to the river bed. We collected river load information by doing random sampling where we lat out a tape measure and decide the river in with in 12 equal intervals. At each interval a pebble is taken and measured and compared to other sections of the river.
River gradient
The river gradient effects the steam velocity which effects the types of transportation of a river. When a river is flattened out the velocity of the steam is decreased and larger bedload carried by traction and saltation is drop and deposited. This can subsequently make or format meanders or even ox bow lakes. How the river gradient is take is by using linometers. Gradients are taken at different distances from the downstream and increased by each time. Bamboo polls are used to make a focus point so readings are more accurate. The bankfull shape of the river channel is also taken. The width and depths are measures accordingly in meters.
Cross sectional area
When finding the cross sectional area we are able to calculate both the stream discharge and the hydraulic radius of the stream. The cross sectional area is affected by the erosion which maybe caused by the water itself or the bedload. The cross sectional area is taken by measuring the channel width the intervals. The depths are also recorded which start at the edge of the back to the other side. The measurements of the channel width are 1st taken. Then the distance between each interval is measured so that each one is the same. Then 10 different depths are taken. 1 from each interval they are measured in centimeters and meters. The trapezium rule is then used to find the cross sectional area.
Channel efficiency
Channel efficiency tells us how efficient the river is. Low efficient is caused by high levels of friction which is caused by the rivers banks and beds. Less efficient rivers often cause floods due to the fact that is less efficient in discharging its water, this is important to flood prone areas due to people trying to change the efficiency of the river were they deepen the river. Lessening the wetter perimeter by smoothing the river’s bed also will cause this problem. I had found the river channel efficiency by calculating the width to depth ratio and hydraulic radius. Width to depth ratio is done by measuring the bankfull width and depth the dived by each other. Hydraulic radius is done by dividing the wetter perimeter by the hydraulic radius.