How will the building of the clay bank between Cley-Next-The-Sea and Salthouse affect people and the environment?
Bashori Rahman
0 T
Geography Coursework
Ms. South
How will the building of the clay bank between Cley-Next-The-Sea and Salthouse affect people and the environment?
Contents Page
Aim + Introduction.......................................................................1
Data Collection :
* Beach profiles.............................................................2
* Sediment Analysis
* Longshore drift measurements
* Wave data observation
* Vegetation Survey
* Questionnaires............................................................3
Data Refinement :
* Beach profiles
* Sediment Shape Analysis..........................................4
* Sediment Size Analysis...............................................5
* Field Sketches and Photographs
* Wave Data Observations............................................6
* Questionnaire Results.................................................7
* Results of Vegetation Survey
* Longshore Drift Measurements...................................9
Data Interpretation :
* Beach Profiles
* Sediment Analysis
* Field Sketches and Photographs
* Longshore Drift Measurements..................................10
* Wave Data Observations
* Questionnaires
* Vegetation Survey......................................................11
Conclusion..................................................................................12
Evaluation
Appendix
Bibliography................................................................................13
Aim
In this investigation I will be aiming to answer these questions:
* Why is the clay bank needed?
* Will the building of the clay bank affect tourism?
* How will it benefit the residents of the local area?
* How will the environment be affected by the building of the bank?
* What will be the consequences if the bank is not built?
* Will it affect the beach or Blakeney spit?
Introduction
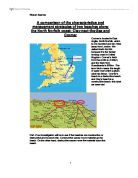
North Norfolk has one of the most beautiful and unspoilt coastlines in England. Natural physical processes have caused a remarkable series of ever changing sand flats, shingle ridges, spits and dunes. Areas totally enclosed from the sea have become fresh water marshes and grazing land, while others remain as brackish marshes and saltings.
Cley-Next-the-Sea is at the start of Blakeney Point, a composite shingle spit 3.5 miles long, stretching west. Behind the spit, a number of habitats have been created. Norfolk Wildlife Trust Cley Marshes is a freshwater marsh, nowadays a very rare habitat. Flooding by sea water can destroy this fragile freshwater marsh.
Many different coastal processes are at work on the Norfolk coast. Long shore drift is a process that carries the shingle on the beaches in the direction of the prevailing wind which happens to be west, and deposits it to create the spit. Wave action is causing the shingle bank to be constantly eroded and is retreating inland at a rate of a metre per year. The ridge is being weakened by wave erosion and so for many years has had to be artificially maintained by bulldozers. However, one bad storm can easily undo two months of building up the ridge. The ridge has even occasionally been breached by the waves as in 1996 when the coast road was left under four feet of muddy reed-strewn water. The ridge is artificially built up as a flood defence to protect the marsh but is not the best defence system as storm surges have passed over the ridge in previous years. The managed section of the ridge costs £40,000 a year to maintain. The work is the obligation of the Environment Agency.
The solution which has been proposed is to build a mud bank on the landward side of the shingle ridge. This would cost over £5million and would be constructed using mud from the site. This would reduce cost and disturbance from lorries. This new line of sea defences will help protect the freshwater ecosystems in the long term.
There are different groups of people who are for and against the building of this bank. Norfolk Wildlife Trust is very concerned about the welfare of the freshwater marsh, therefore they are certainly arguing for the building of the bank. The government is unsure because the bank will cost a lot of money to build - £3.5 million. However Norfolk Cley Marsh is Britain's number one bird watching site and is very valuable to this country's economy. In the long term it will benefit both the welfare of the environment and the bird watching industry.
However, while building the mud bank a lot of problems may occur. The disturbance caused by the workers will frighten the wildlife in the marshes and around the area, therefore birds will move away and the site will not be good for the industry. This will only be a temporary problem because after the bank is built the area will be even better and more protected from coastal flooding. Some conservationists have argued that all the damage done during the building of the bank may cause a long term effect on the area and it may not return to normal or do any better than it should once the bank is built. This is a risk that the NWT must be prepared to take if it wants the best for the environment. The residents of the local areas, which were mainly Blakeney and Cley-Next-the-Sea, had different views on the proposed plan. Some believe the bank will spoil the appearance of the coastline because it is unnatural. Others are unsure of how they feel about the building of the bank.
Data Collection
When we visited the Norfolk coast we collected various pieces of data as part of our investigation.
* Beach Profiles - We used ranging poles to measure each segment of the beach by using a tape measure to record the distance between the poles. We then used a clinometer to measure the angle of the slope. We did this for both the managed and unmanaged shingle beaches because we need to see whether wave action affects the shape of the managed beach compared to the unmanaged shingle beach.
* Sediment analysis - We ...
This is a preview of the whole essay
Data Collection
When we visited the Norfolk coast we collected various pieces of data as part of our investigation.
* Beach Profiles - We used ranging poles to measure each segment of the beach by using a tape measure to record the distance between the poles. We then used a clinometer to measure the angle of the slope. We did this for both the managed and unmanaged shingle beaches because we need to see whether wave action affects the shape of the managed beach compared to the unmanaged shingle beach.
* Sediment analysis - We measured the size and shape of sediment samples from each beach. We took fifty pebbles from each segment of the beach and measured the B axis of each one. We then recorded this data in a tally chart of sediment size.
Next, we placed a ranging pole at the shoreline
and at the top of the beach, and held measuring tape
between them. Every 50 cm we would pick up a pebble and decide which shape it is according to the Powers Scale of Roundness then recorded it in a tally chart of Sediment shape. We needed this data to investigate whether wave erosion affects the managed or unmanaged beach more.
* We drew field sketches and took photographs to see whether there was a physical difference in the shape of the beaches, etc. Photographs and field sketches are an accurate way of recording such data.
* Longshore drift measurements - a ranging pole and a dog biscuit were placed at a point where waves were breaking (swash/backwash zone). We counted fifty waves and then placed another ranging pole at the point where the biscuit had traveled to and measured the distance with tape. We recorded the distance and direction traveled in a table and repeated the process ten times. This data is needed because longshore drift is a natural process that continues to occur along the Norfolk coast. We did this to investigate how rapidly pebbles are carried and deposited by the waves and in which direction.
* Wave data observation - for this data we had to stand on the beach and watch the waves. Information such as frequency, wave height, approach, tide, and wave type were to be recorded. We also noted the direction in which they were moving and the speed. This data is needed as part of the investigation into coastal processes such as longshore drift, and how they are connected.
* Vegetation survey - we carried out a survey in the salt marshes that recorded the different types of vegetation. We set up a transect using a tape measure starting at the seaward end of the marsh running inland. Every 5m we placed a 50cm² quadrat in a standardised manner, the species of plant present were identified and the percentage cover of each different plant was estimated and then recorded. This was done to see whether the type of plant in the marsh varied because of the distance from the sea.
* Questionnaires - We visited the local towns of Blakeney and Cley-Next-the-Sea and asked the local residents and visitors to the area about the proposed plan of the mud bank. We did this to find out how they might be affected by the mud bank and their opinions on the situation.
Data Refinement
Beach Profiles
The two beaches are quite different in shape, as shown by the beach profile diagrams. As you can see, the managed beach has quite a high shingle ridge, whereas the unmanaged beach is rather flat.
The reason for this is that the managed beach is artificially built up each year as a coastal protection scheme to protect the freshwater marsh. The unmanaged beach has taken shape by natural coastal processes being at work. Deposition causes the pebbles to build up on the beach so that that small ones are carried back down by the backwash and the large ones lie at the top, forming a slight slope as the shape of the beach. However the managed beach is artificially maintained and therefore is a different shape. Coastal processes also work here, however the shingle ridge has to be high to prevent sea water from harming the freshwater environment.
Sediment Shape Analysis
The two graphs are not as different as I expected them to turn out. I expected to find more angular pebbles on the managed beach because it is artificially maintained however the pebbles on the unmanaged beach will have been there for years and therefore been worn away by the sea water and much more rounded. On both beaches the most common shape of pebbles are sub-angular and sub-rounded. So, clearly there is not much of a range in difference. Surprisingly, we found no well rounded pebbles on the unmanaged beach however; there were some on the managed beach. There were also more sub-angular pebbles and fewer sub-rounded pebbles on the unmanaged beach than there were on the managed shingle beach which was not what I expected to find. This was only according to our group's sample though, so it may just be unfortunately inaccurate by chance. Although, the graph does show that there were generally more rounded pebbles on the unmanaged beach which is originally what I had expected to find. This does in fact show that the managed beach has more angular pebbles because it is artificially built up each year. The new pebbles that are put on the beach have not yet been eroded by sea, unlike the ones on the managed beach that have been untouched which is why they have been worn away at the edges by the waves.
Sediment Size Analysis
Field sketches and photographs
Wave Data Observations
Waves:
* Frequency = 6 per minute
* Height = approx. 1 metre
* Approach = slightly oblique
* Tide = Falling
* Type = Plunging
Wind:
* Direction = west
* Speed = strong/medium wind
Results of the vegetation survey on the salt marsh (see kite diagram)
The kite diagram shows the percentage of vegetation that was estimated in the 50cm² that was placed every 5m, as we moved inland, away from the sea.
As you can see, Couch grass was only found in the very salty part of the marsh, closest to the sea. As soon as we were 15m inland, there was no more couch grass to be found in the marsh.
Sea purslaine is another type of plant that seemed to grow in the middle of the marsh. There was very little of it close to the sea, but it increased as we moved further inland, but then decreased as we moved roughly 80m inland, after which no more of it was found.
Sea plantain was a type of plant that wasn't seen much, however it seemed to only appear in sections where there was little sea purslaine. The diagram shows that at 25m, where there was no sea purslaine, there was a larger amount of sea plantain, although it wasn't much.
Other plant species such as aster and salt marsh grass didn't seem to show any kind of pattern as to how distance from sea affected the amount of plant found in the marsh.
There was an increase in mud as we moved further away from the sea, but it soon decreased as we approached the shingle beach again, as shingle gradually increased.
Longshore Drift measurements
The graph drawn, represents the distances travelled by each dog biscuit, shows that at times, the waves were quite powerful and strong - such as the waves that were counted for dog biscuit no.7 as it travelled the furthest distance of 110m.
But some waves were not as powerful such as the case of biscuit no.5 which only managed to travel 7.5m.
Data Interpretation
Beach profiles
The two beach profiles show a clear difference in the shape of the two beaches. The managed beach is much higher than the unmanaged beach, which is rather flat.
This is because the managed beach is artificially maintained, and it needs to have a higher shingle ridge so that the freshwater marsh is protected. It is the current coastal protection method that is being used to protect the freshwater marsh. If this method was not used, and the coastal processes were left to work naturally without any artificial maintenance by humans, the shape of the beach would look more like the current unmanaged beach does. The photographs that were taken of the two beaches also show a clear difference in the height and shape of the two beaches.
Sediment Analysis
The sediment size analysis graphs show that on the managed beach, there seemed to be an unspecific pattern in sediment size as we moved up the beach. The graphs show that there were larger pebbles towards the bottom of the beach, near the sea, but the amount of pebbles between 1cm and 1.9 cm varied across the whole beach. Ridge 4 - which is the main shingle ridge that is steep, to protect the marsh - contains rather small pebbles, mostly below 1.9cm. I expected there to be much larger pebbles in this area because this is where the new artificial pebbles will be placed so they will not have been eroded by sea water. However, it could be that these pebbles came from all sorts of different places because we don't know where they come from to rebuild the shingle ridge, so this could be the reason for there being such an unspecific pattern in the sediment size analysis.
On the unmanaged beach, the graphs show a more specific pattern. It shows that as you move further up the beach, away from the sea, the size of pebbles increases because there are more pebbles sized over 2cm on ridge 4 then there are on ridge 1. It also shows that there are more pebbles sized less than 1cm towards the bottom of the beach, near the sea. The reason for this is wave action which erodes the pebbles, throwing them up the beach, but they are then pulled back down in the backwash because they are lighter, which is why they remain at the bottom of the beach. The pebbles at the top are hardly ever affected by wave action which is why they are larger, and they remain at the top of the beach because the backwash of the waves aren't strong enough to carry them back down.
I expected the sediment shape graphs to show more angular pebbles on the managed beach because the wave action does not get a chance to affect these pebbles throughout the year as the beach is rebuilt annually. Although, the graph does show that there were generally more rounded pebbles on the unmanaged beach which is originally what I had expected to find because the waves are able to affect the same pebbles throughout a number of years as these pebbles are not touched in any other way, so they get eroded or worn away at the edges so they are not as angular.
Field Sketches and Photographs
The photographs clearly show a difference in shape between the two beaches. These backup the point I made about what the beach profiles show because they show the same thing.
The field sketches we originally drew where similar to the beach profiles and showed the same as the photographs, therefore I have not included them in this evaluation.
Longshore Drift Measurements
The graph I have drawn, to represent the distances travelled by each dog biscuit, shows that at times, the waves were large and strong - such as the waves that were counted for dog biscuit no.7 as it travelled the furthest distance of 110m.
But some waves were not as powerful such as the case of biscuit no.5 which only managed to travel 7.5m. All the biscuits we used travelled west which makes sense because the wave data observations show that the direction of the wind was also west. This will be the reason why the dog biscuits were transported in this direction.
This data shows why the spit has been formed - because the pebbles are transported towards the west due to the western prevailing wind, and deposited on the land. This was the reason for taking these longshore drift measurements, and also why we took wave data observations - because they are connected processes.
Wave data observations
Theses observations were taken to backup the longshore drift measurement results - because clearly the two processes are connected. Our observations showed that the waves were quite frequent - roughly 6 per minute - and that they were strong, plunging waves with a height of approximately 1m. This would be the reason why dog biscuit no.7of our longshore drift investigation, has travelled so far. When the waves are of this type, the sand, shingle and other material the waves carry, will be deposited at a further distance. The fact that the wind was rather strong will also be part of the reason for such powerful waves being formed. The waves approach was slightly oblique because the wind direction was west, therefore the waves will move in this direction, also.
Questionnaires
We put forward these questionnaires to find out how the residents and visitors of the local towns Blakeney and Cley-Next-the-Sea felt about the proposed plan to build the bank.
A number of residents were unaware of the plan so we had to explain it to them. Most visitors also hadn't heard of the plan, but a few did, possibly because they were regular birdwatchers in the area.
Most people we asked realised that the bank was a coastal protection method for the freshwater marsh, however there were some residents believed it was to save money.
It was mainly the visitors who were definitely for the building of the bank, whereas the residents were rather unsure. The same no. of people said yes and no, and a few were unsure. It seems that the residents are more worried about the consequences of the bank being built, not just for the environments welfare. There were many different answers to the question "how will the bank affect the area if it is built?" A lot of people, especially the visitors, said that it would prevent flooding. A few visitors said that tourism increase whereas, none of the residents had this opinion. But an equal number of residents and visitors also thought that tourism would decrease, so this was quite a varied opinion among the people.
The graph also shows that there were many residents who were more worried about an increase in property values. This could be part of the reason why many of the residents were against the building of the bank, because they feel that it may be a disadvantage to their own financial situations. The residents also said that the bank would spoil the appearance of the coast - more reason why they should disagree with the idea to build a bank. However it seems to me, that this may have been a simple excuse because very few visitors shared this opinion and nearly all of the visitors said that they would still visit the area if the bank was built.
Vegetation survey
The results of this survey didn't show a very distinct pattern. It showed that couch grass only survived in the very salty areas of the marsh, closest to the sea part it couldn't be found as we moved further inland.
It also seems that sea purslaine and sea plantain would not be found together. The kite diagram shows that as soon as the percentage of sea purslaine went down, sea plantain went up. This could however be a simple coincidence, but there is no definite reason why this happens.
The amount of mud found, increased as we moved further inland but soon decreased and was replaced by shingle which increased as we moved towards the beach and out of the marsh. The other species of plant didn't really show much of a pattern.
Conclusion
In conclusion, I think the bank should most definitely be built because the freshwater marsh is a great ecosystem for wildlife, and very rare birds live in the area, which attracts many tourists especially birdwatchers. Tourism plays a valuable part in this country's economy and the area in North Norfolk plays a large role in the tourism industry.
Although it seems that the residents of the area are not so keen for this bank to be built because they are worried about property values increasing and possibly an increase in tax to help maintain the area, it seems that the visitors are all for the building of the bank. They have said that they do not think it will spoil the appearance of the marsh and that they will still visit the area if that bank is built.
While the bank is being built, there will possibly be some disturbance in the area caused by the machines that will be digging, building, etc. for the bank. This might mean that wildlife will be scared off, birds will move away and residents will not be happy about the noise. However this is only a short term consequence, because once the bank is built, there will be less chance of the marsh being damaged by flooding of sea water. Birds and other wildlife will soon come back to the area, and the area will become more attractive to tourists again. If tourism increases, this will benefit local businesses aswell, such as local cafes and restaurants, and B&Bs.
Then of course there is an issue with the cost of the bank. The current method of coastal protection is to artificially maintain the shingle ridge by building it up each year using bulldozers. The ridge is constantly weakened by wave action which is why it has to be built up each year. This is an expensive method - The managed section of the ridge costs £40,000 a year to maintain. The work is the obligation of the Environment Agency. However, one bad storm can easily undo two months of building up the ridge.
The mud bank would cost over £5million to build, but once it has been built, there would be no more extra costs.
This bank will not affect Blakeney spit in any way because it is simply being built to protect the freshwater marsh only. It will also benefit the residents of the local area by protecting the area from coastal flooding.
In my opinion, the freshwater marsh was a good thing to create in the first place because it attracts many tourists to the area especially birdwatchers, etc. who pay good money to see the wildlife. The bank should definitely be built to protect this marsh, because not only does it do that, it also prevents coastal flooding which is a benefit to the local area too.
Evaluation
I think the methods of data collection we used were generally quite good, as many of them gave us accurate results.
The beach profile data we took were extremely useful and very accurate as they helped us to draw accurate beach profiles.
The method we used to measure sediment size however was not as good because it only allowed us to measure the b-axis of each pebble. A more accurate method would have been to measure the perimeter of each pebble, instead of the b-axis because it would show us the overall size of each pebble instead of just a width.
We estimated sediment shape by using "Power's Scale of Roundness". This was quite a good method because there was only really this way to measure sediment shape.
I think we should have investigated the salt marsh a little further. A possible way to investigate further would be to possibly measure the pH of the soil every 5m to see whether it changes as we move further inland. This might have given us a more distinct pattern for the plant species survey.
Appendix
If the bank is not built, the shingle beach will continue to be artificially maintained each year, which in the long term is a more expensive method. Another bad storm surge will probably cause a sever flood into the local towns, and at the same time destroying many habitats in the freshwater marsh. The wildlife will suffer and their homes will be destroyed. Norfolk Wildlife Trust will lose money every time this happens because tourism will decrease if there is no wildlife around and it would cost money to help fix the mess caused by the flooding.
If the freshwater marsh was left to return to salt water marsh, the area would lose out on tourism and the Norfolk Wildlife Trust would be at a disadvantage because the area would no longer be a tourist attraction. Therefore no more money would be made and this countries economy will lose money.
Not only is this area a useful source of money, it is home to many different plant and animal species. Letting the marsh turn back to saltwater would destroy these rare plant and animal habitats, which is very un-environmentally friendly.
Bibliography
www.streetmap.co.uk
Microsoft Encarta Encyclopaedia Standard 2002
http://www.geography.learnontheinternet.co.uk/topics/deposition.html#other
5. DATA COLLECTION How and why you selected the data
a. Beach profiles
sediment analysis
field sketches and potographs
longshore dift measurements
wave data observatons
questionnaies
vegetation survey on the salt marsh
REFINING DATA graphs diagrams annotated field sketches and photographs for each set of data. DESCRIDE what it shows
DATA INTERPRETATION possible reasons for findings and explain why for each set of data
CONCLUSION Answer your question and explain in detail why you have reached your conclusion evidence different groups of people what do they think? Your opinion whether the FWM should have been created jin the first place and should it return to SWM and the building of the Cley bank? Sea levels rise? Use ICT
EVALUATION explain problems with collecting the data Improve? or extend?
APPENDIX Say that the bank is not going to be built. What will the impact be?
BIBLEOGRAPHY websites textbooks etc used
REMEMBER tro label maps graphs etc. Key title North arrow on maps