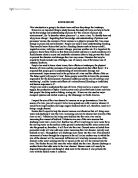
The diagram below shows how each of the measurements are taken.
This graph shows how the water width and the wetted perimeter has changed after every stream order changed. The water width and the wetted perimeter has increased after every stream order changed.
This graph shows the water depth for each stream order. The depth of the left side, the right side and the middle are measured for each stream order. Stream order 2 is the deepest in the middle so that shows that the river was flowing in a straight line. Stream order 3 is the deepest in the right and that tells that the river was turning left. Stream order 4 is the deepest in the middle and that tells that the river was flowing straight.
This graph shows the heights of the right and left banks for each stream order. The heights of the banks have increased after every stream order changed, and the right banks are smaller than the left banks in every stream order.
This graph shows the length of the left and right bank to water for each stream order. The measurements for all the stream orders are almost equal. The right side is higher than the left for stream order 2 and the left side is higher than the right for the third and the fourth stream order.
This graph shows the amount of time it took a cork to travel a metre for every stream order. The cork was dropped three times to measure the amount of the time it took. The time it took for stream order 2 was the longest. Stream order 3 had a shorter amount of time and stream order 4 had the shortest amount of time.
This graph shows the gradient of the river as the stream order changes. The gradient is relatively high at stream order 2, the gradient gets lower at stream order 3 and it becomes the lowest at stream order 4. This shows that the river was going down hill.
The graph above shows the average depth of each of the stream orders. Stream order 2 has a low depth, stream order 3 has a higher depth and stream order 4 has the highest depth.
This graph shows the cross-sectional area of each stream order. Stream order 2 has the lowest cross-sectional area, stream order 3 has a higher cross-sectional area and stream order 4 has the highest cross-sectional area.
The graph above gives the channel width for each of the stream orders. Stream order 2 has a small channel width, stream order 3 has a larger channel width and stream order 4 has the largest channel width of the two stream orders.
This graph shows the average time taken for a cork to move a metre in the river for every stream order. The cork took the longest to move for stream order 2, it took a shorter amount of time in stream order 3 and it took the shortest amount of time in stream order 4.
This graph shows the surface velocity of the river for each stream order. This can be done by dividing the distance from the average amount of time for each stream order. Stream order 2 has the lowest surface velocity, stream order 3 has a higher surface velocity and stream order 4 has the highest surface velocity than the rest of the stream orders.
This Graph shows the discharge of the river for every stream order. Stream order 2 has a low discharge, stream order 3 has a higher discharge and stream order 4 has the highest discharge.
The diagram above shows how most of the measurements are taken with the help of ranging poles. The poles make it easy to measure the bank heights, the water depth and the water width. The poles also help to give the measurements of the right/left bank to water. Care should be taken that the poles are straight or the wrong measurements will be taken. When measuring either the water width, height of the banks or the water depth the tape measure should always be pulled properly and it shouldn’t be loose. The ranging poles can also be used to measure the gradient of the river slope as shown on the “next page”. Measuring the gradient is hard and care should be taken on how deep the ranging poles are kept in the ground. The poles should only be pushed into the ground until the red mark otherwise; the wrong gradient will be taken.
The picture shown below shows how the float time of a cork in the river is taken. Measuring the float time of a cork is the hardest to do because the stopwatch has to be started exactly after the cork reaches point “A” and it should stopped exactly when the cork reaches point “B” and if the stopwatch isn’t used properly the wrong results will be taken.
The picture below shows how the wetted perimeter is taken. The measuring tape is kept across the riverbed at the bottom and the measuring tape has to be held onto place otherwise, the wrong measurements will be taken. The measuring tape can be held in place with the help of your foot; you press down on the tape with your foot and ensure that it doesn’t move. Points A, B and C show where the foot is meant to be when measuring the wetted perimeter.
The pebbles in stream order 2 are big with an average length of 5.75cm and they are very angular with an average roundness of 1.83. The roundness of the pebbles is measured from Cailleux’s roundness index. Most of the pebbles have a low sphericity. The pebbles have not been worn out a lot because the velocity of the river is not fast and so attrition cannot take place easily. If the velocity of the river had been fast, the pebbles would have been smaller and they would be more rounded. Only some of the pebbles are rounded.
The pebbles in stream order 3 are much smaller than the pebbles in stream order 2. The pebbles have an average length of 5.04cm. The pebbles are also more rounded than the pebbles in stream order 2. They have an average roundness of 2.33 and it is measured from Cailleux’s roundness index. Most of the pebbles in stream order 3 have high sphericity. The pebbles are smaller because the river velocity is high and the pebbles have been eroded due to attrition, abrasion or hydraulic action. Therefore, the speed of the river depends on how much the pebbles would be eroded.
The pebbles in stream order 4 have the smallest length and they are the roundest from the pebbles in the other stream orders. The pebbles in stream order 4 have and average length of 2.21cm. They are very rounded so they have an average roundness of 3.66. The roundness is suggested from Cailleux’s roundness index. Just three of the pebbles have a low sphericity and the rest have a high sphericity. The velocity of the river is fast at stream order 4 and so the pebbles have been rounded and worn out more. This can be due to three types of erosion; it can be due to attrition, hydraulic action or abrasion.
STREAM ORDER 2:
Stream order 2 has a very low average depth of water (12.3cm) and it has a small water width (112cm). However the channel width was quite deep compared to the water width .The right side of the bank (10cm depth) has eroded more than the left side (12cm depth) because the river was turning towards the left. The right side of the river has eroded more due to lateral erosion. Hydraulic action and abrasion has caused the erosion on the right side of the river. The force of the river rubs against the bank and erodes the soil, rocks or pebbles are hurled towards the riverbank to cause erosion. The left side had a deposition of soil so the height was increasing. The erosion is not too much so the channel width is not too big (276cm). The velocity of the river is the slowest (0.45m/s) than that of the other stream orders. The photograph below shows how the stream order looks like:
STREAM ORDER 3:
Stream order 3 has a higher average depth of water (26cm) than stream order 2 and it has a higher water width (121cm). The right side of the bank has eroded more than the left side of the bank. This could also be because the river was turning to the left. Therefore, due to abrasion, lateral erosion or hydraulic action the right side of the bank has eroded. The river tends to be slightly deeper on the right side (32cm) and shallower on the left side (21cm). Since there is more depth and high riverbanks, the channel width is also big. The velocity of the river is faster (0.81m/s) than that of stream order 2 and so the speed of the river would erode the side banks. The photograph below shows how the stream order looks like:
STREAM ORDER 4:
Stream order 4 has the highest average depth of water (32.3cm) and the highest banks. The right side of the bank is shorter (154cm) than the left side (176cm). The water width is also higher (135cm) than the rest of the stream orders. The channel width is the highest (387cm) because of the erosion of the banks. The lateral erosion on the banks has been caused due to abrasion or hydraulic action. The velocity of the river depends on the gradient (-2°) (shape) of the river and the amount of friction. The velocity is the highest (1.18m/s) out of all the other stream orders. The river would be straightened due to the high velocity because the banks would be eroded if they are bent in anyway. The photograph below shows how the stream order looks like:
My predictions towards this coursework came out true and I have come up with a conclusion towards to this coursework. My conclusion to this coursework is that the water depth, the channel depth/width, the wetted perimeter, the discharge, the velocity, and the cross-sectional area would increase after every stream order increases. The pebble size will decrease after every stream order increases. The channel depth and width increases because the velocity of the river maybe fast depending on the stream order. If the river is at a turn then the opposite side of the bend would be eroded by the rivers force, so the sides are eroded by “hydraulic action”. Sometimes the river would hurl pebbles at the side causing erosion this is called “abrasion”. When the sides of the river are eroded by abrasion or hydraulic action, the trees usually fall down because they are at the edge of the banks. The force of the river erodes the soil on the sides and the tree roots could be seen. The velocity of the river increases because many small tributaries join the river and that causes the discharge of the river to increase. The velocity can increase if the slope is steep and if not the velocity would be less. If the channel depth and width is high, the wetted perimeter would be high in the river. The pebbles on the riverbed would either be rounded or become smaller on stream order 4 and the pebbles on the riverbed would be either angular or large on stream order 2. The pebbles become smaller and rounded because they hit against each other or they roll on the riverbed and become rounded, this process is called “attrition”. The river had brown cloudy water, which also suggested that material has been dissolved and transported so the process of erosion is called “solution”.
I have finished my coursework and when I was doing it, I encountered many problems and most of them occurred when I was getting my results and when I was taking measurements for river characteristics. Only some of the problems were encountered when I was making my conclusion.
LIMITATIONS OF METHODS:
When measuring the river characteristics the main problem was the mud on the ground because it was raining heavily. The mud made the ground slippery and a few of my classmates fell on the slippery ground. Therefore, it was very hard to measure the river characteristics thus it was hard to carry the equipment to every stream in the heavy rain. The river was very uneven with many turns, so the measurements came out different. The speed of the river increased and it didn’t decrease after the stream order increased. Some of the pebbles that I collected from different stream orders were big instead of being small and some were small when they were meant to be big.
LIMITATIONS OF RESULTS:
My results became wet in Epping Forest due to the heavy rain and it was quite hard to figure out what the results were. I should have carried a plastic pouch with me when I went to Epping Forest Therefore, the results may be wrong, this could make the graphs wrong, and the cross-sections would also be wrong due to this. The equipment that I used for the measuring the stream characteristics was not accurate and it could give me the wrong results. Nevertheless, I acquired quite many good results and they helped me get good cross-sections and some good graphs.
LIMITATIONS OF CONCLUSIONS:
In my conclusions, I stated that the pebbles would decrease in size and they would become more rounder if the speed of the river is high at a particular stream order. Not all of the pebbles were smooth and rounded when the velocity of the river was high, some of them were large and angular. The river water was not too cloudy at some of the stream orders while in some it was. Many of my conclusions are true and they give out the explanation to how the rivers characteristics have changed after every stream order changed.
The measurements of pebbles are taken with the help of a pebblometer. The pebblometer has a measuring axis inside of it and it is used to measure the long axis of pebbles. The pebbles are to be kept on the long axis grid and the length should be suggested. The roundness of the pebbles is taken with the help of the Cailleux’s roundness index. The middle of the pebbles are to be put on the number 0 and then the roundness should be taken. Care should be taken when measuring the roundness because the pebbles middle part should be held directly above the 0 mark and if it is not the measurements will be taken wrongly. Some pebbles don’t have lengths because they are equal on all sides and so it would be hard to measure the length.
The graph shows how long the pebbles are for each stream order and how round they are for each stream order. Stream order 2 has the largest average for the length of the pebbles and stream order 4 has the lowest average length for the pebbles. In stream order 2, the pebbles are angular and in stream order 4, the pebbles are rounded.
Powers’ roundness index is the easiest and simplest way to find out the roundness of pebbles. Therefore, instead of Cailleux’s Roundness index I have used Powers’ roundness index. The roundness can suggested from a chart of pebbles and they are drawn in order from the most angular to the most rounded. The number for the most angular pebbles is 0 and for the most rounded, the number is 5. The numbers range from 0-5 and I have suggested the roundness for the pebbles I have collected from different stream orders. Powers’ roundness index is shown below:
FLOODING:
Flooding is a growing problem. Changes to the climate make it more likely that serious flooding will occur. This country saw some of the heaviest rain ever between October 2000 and January 2001, and Epping Forest District was particularly badly hit. There are three major flood alleviation schemes in the district at Thornwood, North Weald and Loughton. During previous periods of heavy rain, some flooding had occurred because rubbish had been dumped into the ditches of the schemes, blocking the culverts seriously and affecting their efficiency.
DEVELOPMENT ON FLOOD PLAINS:
Floodplains are a result of complex interaction of natural forces and processes that should be respected if flooding problems are to be avoided. Rivers drain groundwater and surface water run-off from developed and undeveloped land. River channels have a limited capacity and when this is exceeded, flooding of the adjoining land known as the floodplain occurs. Floodplains convey and store floodwater during such times, reducing the peak flood flow in the river. The effect of this is to reduce flood levels and
the risk of flooding downstream. The effectiveness of rivers and floodplains to transport and to store floodwater, minimising flood risks, can be adversely affected by any development that physically changes the floodplain. People throw rubbish into the rivers and the rubbish blocks the flow of the river water causing it to flood. The Epping Forest flood was partly caused due to this. The flooding also eroded the banks of the river badly causing the tree roots to pop out and as a result, they weaken and cause the tree to fall. The picture on the next page shows this.
The problems of garbage dumping have still not been solved and many people seem to be dumping the rubbish and when the rainy season starts the river would flood again, but care has been taken and many defences are built in some parts of the rivers. For example, some parts have gabions and they are made from wire cages with rocks in them. The rivers are also cleaned up now and then so the government has worked quite hard to prevent the flooding.