One village shop
None
A town is usually split up into many land uses ex. Inner suburb, twilight zone and CBD (central business district. The CBD is where you will find the department stores, specialist shops, banks and offices.
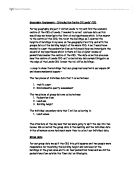
FIG 2.
Core
Zone of
decay
Frame
As you can see in the diagram above the CBD is used for the purposes of commercial and cultural activity in a City. The CBD is usually at the top of the hierarchy in a City. Shops in the CBD mainly sell comparison goods (hi-fi sofa furniture clothes etc.)
High order goods rather than your every day convenience goods (eggs and milk). The peak land value intersection (PLVI) is situated in the core of the CBD, in the core you will find large department stores and chain stores. Smaller specialist shops are usually on the fringe of the CBD this is called the frame. Many people will travel further for the comparison goods because they are comparing prices so they may come to the nearest town or maybe go further for a town which they like this is called the range. There is also more competition now a days with the out of town retail parks which have all the well named high street. This has a great threat tot the town, if the town does not keep the tidiness the pedestrinisation, flowers, benches, nice displays in shop windows and entertainment in the streets, people may just decide to shop in the retail parks.
I have decided to do a study on Cheltenham, Cheltenham has a very well presented CBD, it is a regency town so it still has many of its old spa building which keeps the people coming to shop there. Cheltenham is in the North Cotswolds and is easily accessible from, London, Oxford, Bristol and Wales. There are many motorways near it. The population of Cheltenham is about 112,000 people. The reason for me choosing this is for the ease of my research, I live in Cheltenham so I can easily collect the data and I have had quite a bit of experience with town studys. My title is: How do the following factors vary with the distance from the centre of Cheltenham and why?
- Pedestrian flow
- Shop type
- Quality of environment
I will investigate my title through the following aims:
1. Establish the centre of the town
2. Establish the number and distribution of shop types within the CBD
3. Establish the pedestrian flow in different parts of the CBD
4. Establish the shopping quality and street appearance in different parts of the CBD
Methodology
I collected primary and secondary data to investigate the shopping patterns in Cheltenham town centre
Action plan
Data Collected When Where Why
Primary Data
Pedestrian flow
By recording the pedestrian flow in Cheltenham it will give me a greater understanding of where the greatest number of pedestrians are.
I picked 15 points and placed them on the Goad map and numbered them 1-15, I placed them evenly dispursed around the centre of Cheltenham to give a better understanding of the shopping patterns,after placing the 15 points I recorded the number of people that walked passed me in 6 minutes and then I wrote the exact time of which I started counting I did this twice once in the morniong(10.15-12.15) and one in the afternoon(2.00-6.00)6 minutes was not a long time but is a average time, it was the longaest time I could have for the time I had do it in.
Establishing the centre of Town
To find the centre of town it involved looking at a town map see map which was from the tourist information , to find a centre of a town usually involves looking at the roads to see whare they meet together (nodal point)
Shop type
I collected the data of shop type by walking through the centre of town (Cheltenhem) observing the different shops and recording this on the Goad map using FIG 3. to put them into catergories and placed the letters for each catergory. On the goad map and then later after my recording of data matched the colours with the letters . The reason for me doing was to see where abouts the services are situated in the town to see if ther are clusters or anything unusual and to see if what I have learnt from geographical experience this applies.
FIG 3.
Shopping Environment
To record the shopping environment I went to the 15 different points (see map) I looked at the shop apperance which means what was the shop windows display good or bad was the cleanliness of the building was good or bad and I gave that a score from 1-3. Then I did Street cleanliness at the 15 points this involves looking at the street and see if there is much rubbish or not. Lastly I did the Street apperance at the 15 points this involves seeing if there is flowers, benches, street entertainment and generally a good looking area. I recorded this ason FIG 5. The reason for me collecting this data was so that I can see were the best kept areas are and the worst kept areas are and the to see comparisons between the other results eg. Was the greates
t number of pedestrians walking throw the best shopping environment.