Is There a Heirarchy of Settlement In the Vale of Ffestiniog?
Is there a Heirarchy of Settlement in the Vale of Ffestiniog?
Introduction
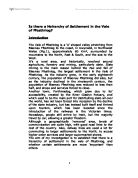
The Vale of Ffestiniog is a 'U' shaped valley stretching from Blaenau Ffestiniog to the coast, in Gwynedd, in Northwest Wales (Fig.1), approximately 80 Km², surrounded by mountains to the North, East & South, and the sea to the West.
It's a rural area, and historically, revolved around agriculture, forestry and mining, particularly slate. Slate mining is the main reason behind the rise and fall of Blaenau Ffestiniog, the largest settlement in the Vale of Ffestiniog. As the industry grew, in the early eighteenth century, the population of Blaenau Ffestiniog did also, but as the industry declined in the nineteenth century, the population of Blaenau Ffestiniog was reduced to less than half, and shops and services forced to close.
Another town, Porthmadog, which grew due to its' accessibility, created by the River Glaslyn Estuary, and which used to be the main port for distributing slate all over the world, has not been forced into recession by the decline of the slate industry, but has instead built itself and thrived upon tourism, which has been boosted since the introduction of the railways in the Victorian times. Nowadays, people still arrive by train, but the majority travel by car, allowing a greater freedom.
Although a geographically 'removed' area, levels of communication are quite high, with good road links to the rest of the country. Also, railway lines are used a lot for commuting to larger settlements to the North, to access higher order services and larger supermarket stores.
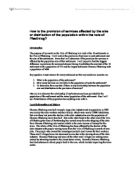
The aim of my investigation is to establish that there is a hierarchy of settlement in the vale of Ffestiniog, and whether certain settlements are more 'important' than others.
What is a settlement hierarchy?
Settlements vary in size and shape, as well as the number of services that each provides. The hierarchy diagram below (Fig.2) shows how the settlement size directly relates to the rank of the settlement. It can be said that there are a greater number of smaller settlements than larger ones and that the larger the settlement, the higher up in the hierarchy it is, due to the fact that it has more functions and amenities and is therefore considered more important.
A trend can be seen in this diagram as you move higher up the hierarchy:
* the larger the size of the settlement
* the less of that type of settlement there is
* the area that each individual settlement covers increases
* the range and number of functions/ amenities increases.
Comparing information such as population and hierarchy index, and using statistical analysis techniques, such as Spearman Rank Correlation Coefficient or Nearest Neighbour, an answer to:
'Is There A Hierarchy Of Settlement In The Vale Ffestiniog' may be found. There are well over thirty settlements in the Vale of Ffestiniog, but my study shall be based around the fourteen listed in the hierarchy table, which are either on, or a very short distance from A and B roads. (Fig.3)
Data that I collected myself shall be used throughout the investigation, and the several intermediate questions;
* Are the services that a settlement has related to its' hierarchy value?
* Is there a link between the population of a settlement and its' hierarchy value?
* Is there a pattern in the distribution of the settlements throughout the valley?
* How strong, if at all, are these links?
shall be answered in order to answer the main question.
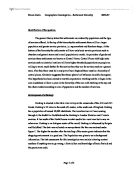
METHODOLOGY
The data used throughout this investigation, was obtained by myself during a residential trip to the area in October 2000, visiting each of the fourteen settlements listed in the matrix. ...
This is a preview of the whole essay
* Are the services that a settlement has related to its' hierarchy value?
* Is there a link between the population of a settlement and its' hierarchy value?
* Is there a pattern in the distribution of the settlements throughout the valley?
* How strong, if at all, are these links?
shall be answered in order to answer the main question.
METHODOLOGY
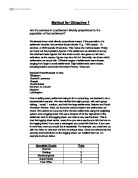
The data used throughout this investigation, was obtained by myself during a residential trip to the area in October 2000, visiting each of the fourteen settlements listed in the matrix. Most of the work was carried out on foot, and a minibus was used for transport between each settlement. The original data collection sheets can be seen at the rear of this folder. With information on the services available in each settlement, a hierarchy value was then created for each one, by recording the services in each settlement into the matrix. When the matrix was complete, the total number of settlements providing each service was counted, the higher the number, the less important that service being. These services can then be weighted, establishing which are of greater importance, by dividing 100 by the total number of settlements offering that service.
e.g.
100 '
Total number of services offering that service
This provides the hierarchy value.
Adding all of the hierarchy values for each service that appears in each settlement will give the hierarchy index, reflecting the importance of that settlement as a whole. (Fig.4)
Upon visiting the various settlements in the Vale of Ffestiniog, it was quite apparent that certain places were of more 'importance' than others, ranging from a few houses and a primary school, to superstores and governmental buildings. Data was collected for each of the 14 settlements visited, and sorted into hierarchical order. Once this was done a pattern emerged:
Settlement Service
Blaneau Ffestiniog
Porthmadog
Penrhyndeudraeth
Trawsfynydd
Llan Ffestiniog
Garreg Llanfrothen
Tremadog
Minfford
Tan-y-Grisiau
Manod
Morfa Bychen
Borth-y-Gest
Gellilydan
Meantwrog
Total
Hierarchy Value
Green Grocer
2
2
50.00
Secondary School
2
2
50.00
Dentist
2
50.00
Baker
2
3
33.33
Solicitor
2
3
33.33
Butcher
2
4
25.00
Clothes Shop
6
4
25.00
Bank
3
4
25.00
Doctor
3
5
20.00
Railway Station
2
5
20.00
Newsagent
3
7
4.29
Garage
3
2
2
3
9
1.11
Village/Church Hall
2
2
9
1.11
Primary School
0
0.00
Public House
4
2
2
2
3
2
1
9.09
Post Office
2
8.33
General Store
6
2
2
3
7.69
Church Chapel
3
3
2
2
2
3
3
7.69
Hierarchy Index
358.54
358.54
258.54
46.88
96.88
87.99
76.48
66.33
60.37
51.48
45.88
43.33
43.15
27.13
Bar the slight anomaly towards the centre of the table (Tremadog), it can be clearly seen that as the hierarchy index decreases, the number of amenities available in that settlement decreases also. Not only that, but, less of the higher order services are available, such as the green grocers' or solicitors'. (The highlighting and overlay line tries to emphasize this).
A low order service is one of necessity or frequently used by the same customer, such as the general store, whereas a high order service is one that is of luxury or shopping, bought or used infrequently. Green Grocers are not normally regarded as high order, but there were many stores that sold 'greens' but very few were strictly Green Grocers', and it may in fact not be the highest order service.
The services listed are only a selection of the services available in the settlements, and were picked because they include a variety of both high and low order. There are reasons behind Tremadog having such a high order service, the designer clothes shop, when its' hierarchy index is as low as it is, 76.48. Temadog is a planned, 'T' shaped settlement situated at the junction of two main roads, the A467 and the A498. Tourists frequent it and so there are few specialist shops that are geared towards them, rather than the local residents.
As the 'weight' of each settlement decreases, the recurrence of the same amenity or service available also decreases. This is because the larger settlements cover a greater area and have a greater sphere of influence. Consequently, the same service has to be repeated throughout the same settlement, in order for it to serve the number of people in its range. Some smaller settlements have, at most, one of a few of the listed amenities. This is because the threshold of that particular service is met by only it's single occurrence in that settlement. There is also a pattern in the hierarchy index, and this is demonstrated in the 'Hierarchy of Settlement' graph.
A general statement can be made that as the hierarchy is descended, each successive settlement is on average, approximately 18% smaller than the previous one, though there is an exponential decay from the largest of the settlements. (Fig.5)
When the data in Fig.4 was sorted into descending numerical order of the hierarchy index, and cross referenced with the population of the related settlement, some interesting results were found, and when looked at in more detail, a relationship between population size and settlement hierarchy index was revealed, directly linking them to one another.
The relevant data from this finding was put into a formula, Spearman Rank Correlation Coefficient (SRCC), in order to calculate how strongly they are related to one another. (Fig.6.a)
Fig.6.b shows that there is a strong positive correlation (steep, positive gradient) between the population and the hierarchy index. This is because people are attracted to a particular settlement by the services that it has to offer. This in turn increases the population of the settlement due to the influx of residents. Generally, the more people there are in an area, the more services there are in that area. When there is a sufficient population, higher order services can be supported, as the threshold of that service is satisfied. This is a perpetual cycle, which eventually leads to urban sprawl, but is the reason why there is such a strong correlation between population and settlement hierarchy.
A correlation of over 82% between population and hierarchy index seems very convincing, but it has to be statistically significant in order to prove anything. The statistical significance (SS) of the correlation can be easily calculated by referring to the SRCCSS graph. (Fig.6.c)
The interpretation of the graph shows the statistical significance of the data I have plotted in the Population/Settlement Hierarchy graph (Fig.5). The intersection of the two lines (Degrees of Freedom and the SRCC) lies between the 0.1% & 1% significance levels, being very much closer to the 0.1% curve. This means that there is almost a 99.9% chance of my data being accurate, and only a 0.1% likelihood of the correlation occurring as a anomalously.
This nearest neighbour index (NNI) (Fig.7.a) shows the spatial distribution of the settlements under study in the Vale of Ffestiniog. Rather than simply looking at the map of the area and suggesting whether the settlements are clustered, regularly spaced or random, a mixture of both, it can be done accurately and mathematically. The index is derived from the average distance between each settlement, and its' nearest neighbour. These are then placed into the formula, and the results compared to a set of known values, between 0.0 and 2.15, from which the pattern can be determined.
As my result came to a value of 1.21949, it can be said that the pattern of distribution of the settlements under study in the Vale of Ffestiniog is random. But this has to be proven statistically, as did the SRCC.
The NNISS graph (Fig.7.b) indicates that my results are statistically insignificant, as the possibility of my results occurring by chance is too great, at just over 10%. This does not mean that my findings are entirely inaccurate, it just means that more settlements would have to come under observation in order to do as much as possible to eliminate the possibility of an anomaly.
Evaluation
All of my results seem to show that there is some sort of relationship between the population of a settlement and its' hierarchy index. Some methods that I have used have been more conclusive than others, but the general trend is of a strong positive correlation between population and hierarchy index.
This is due to a reason, which is illustrated in paragraph 1, page 6, which can also be referred to as the 'snowball effect'.
The results were expected, and that is one of the reasons' that I posed the question in the first place.
It appears that there is a 'grading' of the settlements in the Vale of Ffestiniog, but the question at hand is whether it is hierarchical. As expected there is not a perfect correlation between the hierarchy index of a settlement and the services that it possesses (Fig.4), but there is sufficient evidence to suggest that there is some sort of a relationship. Despite the fact that the two major settlements in the Vale of Ffestiniog, Blaenau Ffestiniog and Porthmadog, have the same hierarchy index, they are not both truly 'equal', as the latter, has a greater frequency of the same services throughout, and the former a greater population. However, the hierarchy index graph (Fig.5) reinforces and supports the background information contained in Fig.2, that there are only a few settlements in the area with high indexes and that they have a greater range and number of services. It also shows that there are many settlements with approximately the same, relatively low hierarchy indexes.
If I were to extend this work, an inclusion of all settlements in the area would be a must, as to try and build an accurate picture, and establish whether or not there is a hierarchy of settlement, not based on a sample. This investigation could in fact be extended far beyond the Vale of Ffestiniog, to the North of Wales, or indeed the whole country, and this would enable a much more general trend to be established. This would however, be far too much work for the time allocated. If time had allowed samples could also be taken right across the country, and then analysed to see whether there is a pattern, and whether there is a change in hierarchy between rural and urban settlements. This could be done in many ways, using either random or strategic sampling.
The distribution of settlement in the Vale of Ffestiniog is somewhat random, and, according to Fig.7.b inconclusive. Even so, I think that there is a rational explanation for this distribution pattern.
The Vale of Ffestiniog, as the name suggests is a valley, a 'U' shaped valley, sculpted by glaciers during the last ice age. The whole area consists of undulating hills, at the foot of Mount Snowdon, and so settlements tend to be in the lowest parts of the valley, close to the Afon (river) Glaslyn and Colwyn. This would account for the apparent random distribution suggested by the NNI (Fig.7.a), but an inspection of the site map (Fig.3) would show that the 'placement' is quite strategic.
If there was to be a further line of enquiry, I would like to investigate whether there is a hierarchy of settlement in more urbanised areas of the country, or whether hierarchies are different in other countries.
If I was to conduct the investigation again, I like to have taken more photographs in each settlement, so that there would be more 'visual' evidence of a hierarchy. Also, if it was at all possible, I think that aerial photographs would greatly enhance the project, showing size and type (linear, nucleated etc.) of each settlement.
On the whole, I think that the facts contained throughout this document are substantial enough to support the general statement that;
There Is A Hierarchy of Settlement In The Vale of Ffestiniog.
Acknowledgements
With thanks to Finham Park School Geography department, and the Plas Dol-y-Moch staff.
Bibliography
Oxford Advanced Geography, Nagle
http://www.multimap.com
thegeographyportal@http://www.tgp.com
1