Safety:
Precautions taken before entering the field:
- Appropriate water proof clothing had to be worn e.g. waders
- A spare set of clothing had to be brought
- There had to be risk assessments of the sites we were visiting
- Buoyancy aid and hard hat had to be worn at all times
- Open cuts had to be cover before going to the river to prevent Weil’s disease
- There had to be the safe use of equipment
- An emergency plan had to be made and someone else not going to the field must have known where we were
- A mobile phone had to be brought out on the field in the case of an emergency
- First aid kit
Sampling:
We used a technique called pragmatic systematic sampling. This meant that we got a good range of sites along the river but we could avoid dangerous sites by taking the nearest safest point.
To collect our data at the different site we spilt into groups of 3. This meant that there was 1 person recording the data and 2 in the field collecting it.
Data collection:
It was very important that we used the equipment safely:
Task A - measuring the velocity of the river
Equipment used at this site: Stopwatch, Tape measure, Data recording sheets, floats
We used two ranging poles that were placed 10 meters apart. The float was let go in the river and timed between the two ranging poles. The time was recorded and the task was carried out three times to get an average.
Task B – Measurement of Bed load
Equipment used at this site: Data recording sheet and a copy Powers roundness index.
One member of the group randomly chose 12 stones with a metre stick.
Then the second and third member of the team analysed the stones and compared them to powers index chart to determine the shape of the stones.
Task C – Measuring the discharge
Equipment used at this site: tape measure, metre stick, flow meter and data recording sheets.
In this task we chose a line of cross section of the river. The width of the river was then measured on the surface of the water from right bank to left bank and then recorded on the data sheet. The flow meter was used to find the velocity of the river, we took 3 readings at each interval and got an average. To use the flow meter you place it in the water, facing up stream, and leave it for 10 seconds and then take the reading on the display box. The metre stick was then used to get the depth of the river at different intervals. These intervals were determined by the width of the river which was at 10 evenly spaced intervals. We calculated the average depth of the river at each site and we could also work out the discharge using a formula, =width x depth x velocity.
Task D- measuring the gradient of the river
Equipment used: ranging poles, theodolite, and staff
One member of the group placed the staff on the surface of the water. The other member of the group stood on up the river (approx 10 metres) with the theodolite which is an automatic leveller. The group member looked trough the theodolite and took the readings of the staff and they were recorded on the data sheet. After the data was used with a formula to work out the gradient.
Secondary Sources
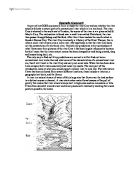
We used an ordnance survey map of the River Roe drainage basin to determine our sites and distance downstream.
We used Waugh’s Integrated Geography Approach to help with background theory.
All the results were placed on a table.