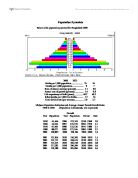
Population structures:
Hong Kong 2000
2000 2025
Births per 1,000 population.................... 11 8
Deaths per 1,000 population.................... 6 9
Rate of natural increase (percent)............. 0.5 0.0
Annual rate of growth (percent)................ 1.3 0.0
Life expectancy at birth (years)............... 79.5 82.2
Infant deaths per 1,000 live births............ 6 4
Total fertility rate (per woman)............... 1.3 1.6
Midyear Population Estimates and Average Annual Period Growth Rates:
1950 to 2050 (Population in thousands, rate in percent)
Growth
Year Population Year Population Period Rate
1950 2,237 1996 6,420 1950-1960 3.2
1960 3,075 1997 6,607 1960-1970 2.5
1970 3,959 1998 6,813 1970-1980 2.5
1980 5,063 1999 6,992 1980-1990 1.2
1990 5,688 2000 7,116 1990-2000 2.2
1991 5,752 2010 7,981 2000-2010 1.1
1992 5,834 2020 8,661 2010-2020 0.8
1993 5,944 2030 8,700 2020-2030 0.0
1994 6,083 2040 8,352 2030-2040 -0.4
1995 6,247 2050 7,756 2040-2050 -0.7
Hong Kong is one of the most advanced countries in the world. High level of medical care and massive pensions increase the level of old people above the age of 65. The main work group of this location are between 30 and 54 whilst the population below this age range are in full time education or in gangs, which is not an official employment. The people in this range are also the result after the war Hong Kong had with Japan. The birth rate is evidently low because many young fertile people go into education and have little time for children until they reach there 30’s where their fertility will have dropped dramatically. Being one of the centre of the largest companies in the world, hence boasting a high quality of life which leads to a long life Hong Kong is in the 5th level of the DMT since most or all the jobs are in the tertiary and quaternary level.
USA
2000 2025
Births per 1,000 population.................... 14 14
Deaths per 1,000 population.................... 9 9
Rate of natural increase (percent)............. 0.6 0.5
Annual rate of growth (percent)................ 0.9 0.8
Life expectancy at birth (years)............... 77.1 80.6
Infant deaths per 1,000 live births............ 7 5
Total fertility rate (per woman)............... 2.1 2.2
Midyear Population Estimates and Average Annual Period Growth Rates:
1950 to 2050 (Population in thousands, rate in percent)
Growth
Year Population Year Population Period Rate
1950 152,271 1996 265,463 1950-1960 1.7
1960 180,671 1997 268,008 1960-1970 1.3
1970 205,052 1998 270,561 1970-1980 1.0
1980 227,726 1999 273,131 1980-1990 0.9
1990 249,948 2000 275,563 1990-2000 1.0
1991 252,639 2010 300,118 2000-2010 0.9
1992 255,374 2020 325,183 2010-2020 0.8
1993 258,083 2030 351,326 2020-2030 0.8
1994 260,599 2040 377,606 2030-2040 0.7
1995 263,044 2050 403,943 2040-2050 0.7
Midyear Population, by Age and Sex: 2000 and 2025
(Population in thousands)
America is also, one of the most developed countries in the world. Having the second largest population in the world it has a massive variety of jobs. Most of them are now days in the tertiary sections. The lower birth rates indicate that America is an MEDC due to family planning and highly paid jobs. There is a large amount of people aged between the ages of 40 and 50 due to the Vietnam War in the 1950-1960’s and this is evidently a baby boom after the war. High levels of people over 60 are due to the better facilities available. A large pension and government policies (such as the NHS in the United Kingdom) result in a longer life expectancy and a more luxurious life. Either sides of the population are relatively equal until you reach the over 60 where the female population is high, but this is because women have a tendency to live longer. Since most of the jobs are based in the tertiary the USA is based in the 5th level of the DMT. This however is because it has some of the main head quarters of most of the world largest business such as Microsoft.
The consequences of population of Bangladesh changing means that the world population will be reduced and the government will find it easier to govern. Hong Kong like Bangladesh will also reduce in population, which means the overall world population, will be reduced. Since there will be less people it will also mean that land in Hong Kong will more readily available. America however, is the problem by 2025 the giant of all increases in birth rates will result to expansion outside the country. The world population will increase hugely in years to come and this expansion may lead to war in the long term. The massive amount of older people, which will be present in the world, will affect the economy of a country dramatically because the dependency ratio will increase tenfold. Hopefully the working age will have increased higher the 65+ as people receive better health care, which means they will be healthier and may be able to take the strain of work.
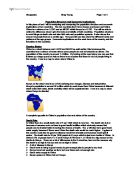
Angola is one of the most under populated countries in the world. However, the implications of its growing population indicate that it will become like Bangladesh by 2030 with a massive birth rate an a low life expectancy (like the typical population ‘pyramid’) This however changes by 2050 with a reduction of birth rate, unfortunately this is later and the world will experience a 3rd world country when most have gone into about the 4th level of the DMT. Evidently this country will be a producer of goods, and house primary jobs.
One of the largest countries in the world is China, and ever so slowly it is becoming more and more advanced. This is evident from the implication the census shows. Over time China’s birth rate will fall and the population above the age of 65+ will result more than the people below that age of 30. As China clambers into becoming an MEDC it is also evident that it is beginning to appear like Hong Kong with the age groups all being virtually even. It is possible that the reuniting of China on July 1997 has affected it by introducing new ways and a new economy. Over all China’s population will fall and the female to male ratio will become even.
Over time the birth rate of the United Kingdom will fall and the level of old people will increase. This means that the United Kingdom will be becoming more and more advanced in technology and health care. This however, will be countered by the rise of old people as there will cause the dependency ration to increase. This thereby causes more working hours for the working age. More importantly is that more and more people will still be in education until about 25 to cope with the advancing world. This will leave only a selection of 25-60 year old in the working industry that will drastically affect the dependency ratio.