All Widths in cm
Averages
The average width for each site is:
Site 1 – 354.4cm
Site 2 – 469cm
Site 3 – 648cm
Site 4 – 1640cm
Graphs
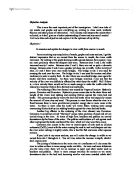
Description
This shows that the width increases from Site 1 to Site 4. This is because of erosion and man management. At Site 1, there is less erosion in the form of corrasion and the large bed load slows down the speed of flow of the river, which makes the hydraulic power less effective. does not erode as much as the other sites. At Site 2, there was a line of large rocks along one side of the river next to the farm to stop erosion occurring and therefore destroying the farmland. This shows the first signs of man management in the river and shows that this is not a ‘perfect’ river. However, the width still increases on the other side of the river where an ox-bow lake is visible, and because this riverbank is allowed to grow, as shown by the overhang formed at the riverbank, the width at Site 2 increases from that at Site 1. There is also a bridge but that is further down the river so is irrelevant to our results. At Site 3, the width increases because there is more erosion by way of hydraulic power and corrasion and the only human intervention at Site 3 is a bridge, but seen as that is further down the river from where we were, it has no impact on our results. At Site 4 the width is in many cases over double those in Site 3. This part of the river has been modified because it runs through a residential/developed area, Lower Fishguard. The width has been increased to prevent/lessen the risk of flooding in the area. Also, there were gabions at either riverbank, which have been placed there to stop the width increasing and wrecking homes/businesses/gardens/etc.
Depth
Hypothesis
I predict that the river will become deeper from Gellifawr to Lower Fishguard. I think this will happen because of erosion, chiefly hydraulic power and corrasion. The load will wear away the riverbed, causing the river to be deeper the lower down the river you go. The water will be moving quickly and the force will loosen and wear away parts of the riverbed, making it deeper. By the mouth, it will get shallower because the river will slow down and will deposit some of the load. Also, bed load that moves by way of traction [rolling/bouncing along the river bed (load)] will scrape off parts of the riverbed as it moves.
Method
The way we measure depth is holding a tape measurer across the width of the river, and at 25cm intervals, placing a 1m ruler in the water until it hit the riverbed. We did not dig it into the ground or move bed load out of the way because that is tampering with the depth. Once we had covered the whole stretch of the river, we made an average.
Results
Averages
The average depth for each site is:
Site 1 – 19.06 cm
Site 2 – 36.05 cm
Site 3 – 34.82 cm
Site 4 – 34.14 cm
Graphs
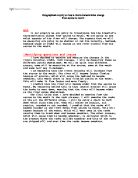
Description
The deepest part of the river at any site was -125cm at 100cm across at Site 4. This was an anomalous result and probably happened because the metre ruler slipped between two (large) pieces of bed load. The highest average depth was Site 2, with -36.05, marginally ahead of Site 3 (-34.82) and Site 4(-33.98). The deepest depth was a lot deeper than any other depth because at there was bed load at each site which affected the depth and there were many large rocks (piled up) in Site 4 as a flood/riverbed defence so we probably slipped down the side of the rocks. The average at Site 2 was higher because:
- Of man management in Site 4 preventing more results such as the –125cm depth occurring and causing the depth to frequently rise and fall unsteadily.
- The width is narrower in Site 2 than in Sites 3&4, therefore less widths measured and a lower number as the denominator (every 25cm the depth was measured at so the wider the river the more results there are and seen as the average = Total sum of results/Total amount of results, if you’re dividing by a higher amount it decreases the average width with each extra result) which makes the average width higher.
This proves that the average depth is not a fair method of measurement because most of the widths in Site 4 were larger than those in Sites 2&3 and it only had a lower average because of the amount of results were over double those in the other sites, which lead to a higher denominator and therefore a lower average.
This proves my hypothesis correct because the depth increased from Site 1 to Site 4. This is because the river gets faster, increasing erosion from hydraulic power.
Speed
Hypothesis
I predict that the river will flow faster from Gellifawr to Lower Fishguard. I think this will happen because of hydraulic power, bed load size and corrasion. The greater the hydraulic power is, the more energy the river has and therefore the faster it will go. When there is lots of (large) bed load on the riverbed, it slows down the river in some parts and can also create rapids/turbulence.
Method
The way we measured speed was by using two ranging poles and placing them 10m away from each other. Then we timed how long it took for a tennis ball to travel the whole 10m with a stopwatch. We then made averages for each site. We used a tennis ball because it was not too heavy/light and although it floated. It wasn’t too easily affected by the wind and depended nearly completely on the river. We did a distance of 10 metres because it doesn’t take too long to measure and because many other people were doing measurements we needed an area that didn’t take up lots of room. We made an average to make our results more accurate and repeated it 5 times because it was as accurate a number of repetitions we could manage in our time limit at each site.
Results
All speeds in seconds
Averages
The average speed for each site is:
Site 1 – 37.554 seconds
Site 2 – 25.542 seconds
Site 3 – 13.442 seconds
Site 4 – 18.154 seconds
Graphs
Description
The results show that the speed of flow increases from Site 1 to Site 3 but then decreases at Site 4. Part of this is due to erosion; part is due to human interference. In Site1, the bed load largely influences the speed. The bed load is mostly large and angular and the slowest speed of flow we recorded (1min5seconds – 2nd speed measured at Site 1) was so long because it was caught by bed load and had to be loosened otherwise it would have been void. In Site 2, the entire bed load was (evenly) spread out over the riverbed and was mainly small (round) pebbles. This had little effect on the speed. In Site 3, the bed load was inconsistent in size and shape and did not have a (big) impact on the speed of flow. In Site 4, the river had been modified so the speed of flow was fast (therefore less deposition at the riverbanks/on the riverbed which decreases the risk of flooding) but it was slower than Site 3 because it was at the mouth of the river so was beginning to slow down, because of the human interference and because most of the bed load is large to stop erosion and spread out along the riverbed to minimise flood risk.
Discharge
Hypothesis
I predict the river discharge will increase from Gellifawr to Lower Fishguard. I think this because discharge = length x width x speed, and if they all increase like I predict, then the discharge would then subsequently increase.
I will only use the average discharge because it is the most accurate/even/fair discharge and it gets complicated when deciding and justifying which speed goes with which width and which depth, etc.
Results
Graph
Description
The discharge increases from Site 1 to Site 4. This is because of all the forms of erosion that are actively involved in the increase of width/depth/speed of flow the further down the river you go (primarily corrasion and hydraulic power) and also the way that humans have edited the course of the river for their own benefits e.g. widening the river near residential/urban areas to prevent floods at Site 4. This proves my hypothesis correct.
Bed Load Size
Hypothesis
I predict that the bed load size will decrease from Gellifawr to Lower Fishguard. I think this because as the water picks up speed, it has more energy and therefore can transport more/bigger bed load. The bed load:
- Rubs against the riverbanks or other rocks, making it smaller and smoother (Suspension, Saltation)
- Bounces along the riverbed, chipping bits off it by banging into other rocks (and transferring energy to them which may make them move) or rubbing against the riverbed (Traction)
The main processes of erosion are corrasion (see bullet point 1) and attrition (both bullet points).
Method
The bed load was randomly chosen from the riverbed. We measured its length by using a 1m ruler and measuring from its longest axis. We then recorded down if it was Angular (Graded 1), Sub-Angular (2), Sub- Angular/Rounded (3), Sub-Rounded (4) and rounded (5). We then made averages of the lengths of bed load at each site.
Results
Site 1 Site 2
Site 3 Site 4
Averages
The average speed for each site is:
Site 1 – 21.65m/s
Site 2 – 18.15m/s
Site 3 – 11.5m/s
Site 4 – 22.7m/s
Graphs
Description
The results show that the size decreases from Site 1 to Site 3 but is largest at Site 4. This is because humans have covered the riverbed in Site 4 with large rocks to stop the river getting too deep/any deeper and possibly eroding/flooding farms/houses/shops/etc. The results suggest there may be a possible link between the size of the bed load and the speed of flow. At Site 1, most bed load was of size 21-25cm, compared to 11-15cm in Site 2, 6-15cm in Site 3 and 16-25cm in Site 4. The largest average bed load was Site 4 (22.7cm) and the smallest was Site 3 (11.5cm), which shows that the average is in the middle of the most common group of sizes and can represent which site had the largest bed load. There was one anomalous result, which was 50cm from Site 2. There were no samples under 6cm, which is quite odd because there should be lots of small pebbles in the lower sites but because Site 4 in particular had large rocks added to the riverbed to stop erosion, I did not find any.
Bed Load Shape
Hypothesis
I predict that the bed load shape will become smoother/more rounded from Gellifawr to Lower Fishguard. I think this because as the water picks up speed, more bed load is moving at a higher speed so when it collides with another rock or the riverbed/riverbank it will take off more angular bits/rasp rough edges. The main processes of erosion are corrasion and attrition.
Method
The bed load was randomly chosen from the riverbed. We measured its length by using a 1m ruler and measuring from its longest axis. We then recorded down if it was Angular (Graded 1), Sub-Angular (2), Sub- Angular/Rounded (3), Sub-Rounded (4) and rounded (5). We then made averages of the lengths of bed load at each site.
Results
Site 1 Site 2
Site 3 Site 4
Graphs
Averages
Site 1 – Angular/Sub-angular (5&4)
Site 2 – Moderate (3)
Site 3 – Moderate (3)
Site 4 – Moderate (3)
Description
The most common shape(s) of bed load in:
Site1are angular and sub-angular with 40% each and 80% (16 samples) overall. There is no rounded sample and only one sub-rounded sample, which suggests the vast majority of bed load in Site 1 is angular and sub-angular. This is in line with my prediction.
Site 2 is moderate with 40% but 5% (1sample) less is sub-angular. There is no rounded sample yet only 1 angular sample, which suggests the vast majority of bed load in Site 2 is sub-angular and moderate. This is in line with my prediction
Site 3 is moderate with 40% but 5%(1 sample) less in second was sub-rounded. There was no angular sample and only one sub-angular sample which suggests that the vast majority of bed load in Site 3 is moderate/sub-rounded. This is in line with my prediction.
Site 4 is moderate but only by 5% (1 sample). The lowest was rounded but the range was only 2 samples (10%) which shows that there is nearly an even distribution of different shaped bed load in the site. This proves my hypothesis wrong but had there been no human interference in this site it would almost certainly have.
Over the whole river, the most common was moderate. There was less rounded than angular and less sub-rounded than sub-angular, which is probably because of the modifications in Site 4 that added extra sub-angular and angular bed load.
Links and Relationships
Some of the results from the River Gwaun will be influenced/linked with other results, for example the width could be linked to bed load size/shape because as corrasion erodes the riverbanks making the river wider the bed load gets smaller/smoother.
Is there a link between the speed, width and bed load?
The possible link I am investigating is if the speed of flow is linked with width and also with bed load size. I think that because as the river gets more energy, it becomes quicker, picks up (more/bigger) bed load, which erodes the sides of the river (more) and making the bed load smaller, thus showing that there is a link between them.
Results
Graphs
This graph shows that as the river width increases, the river gets faster. The result for Site 4 would be in line with the other sites had there been no human interference.
This graph shows how the wider the river gets, the smaller the bed load is. Site 4 is again an anomalous result because of the human interference, but there is an obvious trend shown from the other sites.
This graph shows that as the river gets faster, the bed load size decreases. Again, Site 4 is an anomalous result because of the human interference there. However, it is still easy to see the pattern that the river (would have) follows (followed).
The results and graphs have proved my hypothesis about a link between the speed of flow, bed load size and width right up to Site 3. Site 4 would have followed the same pattern had it not been tampered with.
Conclusion & Evaluation
The results from the fieldwork have proved that the further down the river you go, the wider, deeper, faster the river is and the smaller and smoother the bed load is. That is if the river has not been modified, though as proved by the results in Site 4, in particular the bed load samples.
There were some problems with the methods and results from the fieldwork. The main problem was that the river had not run its natural course; it had been modified to suit people like farmers (Site 2 – the large rocks against one side of the river to stop it eroding the farmer’s garden and more bed load was added to stop it becoming deeper and eroding the garden from underneath) and townspeople (Site 4 – widened, gabions put up to stop width erosion and riverbed covered in lots of large, angular rocks to stop the river eroding and flooding homes, businesses, etc.). This affected the results at the sites, especially at Site 4, which had the largest bed load when it should have had the smallest and was slower than Site 3.
As well as the river hindering our results, there were human errors as well. Simple things like misreading the ruler and not stopping the timer at the exact time the tennis ball crossed 10 metres or being just over/under 10 metres probably happened, but also instances such as when measuring speed the tennis ball was stuck behind a rock, anomalous results, etc. can wreck the investigation’s results, which is why measures such as taking averages and repeating ones that went (horribly) wrong were taken to either avoid or minimalise the damage caused by such events.
Some decisions on methods can also change the outcome of an investigation; how many sites to go to? How many widths/depths/etc. should be recorded? How many repetitions should be done? Etc. Most of these factors are down to how much time you have to do your investigation. I couldn’t do 10 widths and 10 repetitions or have 50 bed load or go to 12 sites, etc. because I was only at each site for 45 minutes and there would be no time for other things. Another important decision is to decide when to go. In summer there is less rainfall so the depth is lower than in winter, which can affect the discharge, speed and width, as well as speed, which then affects the hydraulic power and erosion levels. The field trip I went on was in June, but it was postponed twice because of torrential rain making it dangerous to work in, so the climate also affects the results.
However, a lot of my predictions made in the hypotheses sections of each aspect measured were correct, or correct in parts. The ones that were not correct, particularly bed load and speed in Site 4, was because of human intervention and I believe that, had the river run its natural course, would be correct. I did successfully fulfil my aims, which were to investigate the changes in the river Gwaun as it goes from source to mouth and I have documented it well.
Overall I am happy with my set of results. I believe that all of the results that were odd and other things that went wrong were unavoidable and it might have balanced out the conditions with other times of the year. Any errors with the results would be natural as they are never going to be perfect, especially if the methods are not done with top-of-the-range equipment and technology that professionals use.