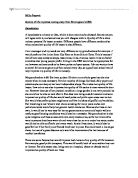
Map of Maidenhead
There is also a more detailed map with my sites noted on it in the appendix.
Short history of Maidenhead
The Romans established maidenhead in 1112. It then didn’t become that prosperous until a century later, when it started trading cloth to London. This business soon collapsed though. Maidenhead returned to prosperity in the 18th and 19th centuries with stage coaching companies. In 1883 the railway came to Maidenhead, providing a way to get to London and Bristol. In the Second World War many people evacuated London and came to Maidenhead. Following the Construction of the M4 in 1972 commuters started coming into maidenhead. This established maidenhead as an important town in east-Berkshire. Now Maidenhead has become a thriving mixture of high technology industry and commuter town.
My Aim, Hypothesis’ and how to prove them
My Aim
To investigate urban changes (as listed above) as distance from the central business district increases.
My Hypothesis’
I predict that the following things will happen:
- The closer you are to the CBD the higher the house prices will be but there will be a lapse in the centre and houses in the suburbs will also cost more. I can prove this by looking at a city ordinance map that shows house prices and looking at an average in an area, moving away from the CBD.
- The further away from the CBD you go the less traffic there will be. To prove this I can make traffic counts lasting 10 minutes in which I count all forms of traffic passing.
- The further away from the CBD you go the less pedestrians there will be. I can use the same method as above to prove this.
- In the CBD and close to the CBD there will be more cars then pedestrians but as you go further away there will be an increase in pedestrians with ratio to cars and other vehicles. To prove this
- The further away from the CBD you go the more open space you will get.
- The further away from the CBD you go the better the housing quality will get.
- As you go further away from the CBD the environmental quality will improve.
Theory
This is the theory being applied to my research.
I’ll start with the CBD; this is the heart of a settlement. It is where most of the business of the settlement is carried out and the most important part of any settlement. A CBD is likely to have many of the following characteristics:
- It has a distinct land use pattern that can be delimited from the rest of the settlement.
- It is the geographical centre of the settlement.
- It contains the settlement's main public buildings.
- It contains the major retail outlets.
- Similar activities within it are concentrated in certain areas.
- It has the greatest concentration and number of pedestrians and traffic in general.
- It is a focal point for transport.
- It contains the greatest proportion of the settlement's offices.
- It has the tallest buildings in the region to maximize land use.
- It has the highest land values of the region.
- It attracts people from outside its sphere of influence to work and spend money inside.
- It is advancing into new areas and losing old commercial functions.
The concentric Land use models
There are two main land use models, the burgess and hoyt models, they go like this:
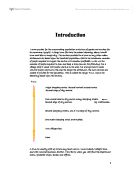
The burgess land use model:
According to this model, a large city is divided in concentric zones with a tendency of each inner zone to expand in the other zone. Urban growth is thus a process of expansion and reconversion of land uses. For instance on this figure zone II (Factory zone) is expanding towards zone IV (Working class zone), creating a transition zone with reconversion of land use. This model does have drawbacks though, it is way to simple and was a product of the 1950s where it could only be applied to American cities. It is still useful though because it can be used for approximation of urban land use and as an introduction to land use.
The Hoyt land use model:
The Hoyt model has land use concentrated in wedges or sectors radiating out from the city centre. For example, factories may be concentrated along a river, canal or road to form a zone of industry. This would attract low-class housing, but repel high-class residential land use. This is a much more practical land use model then the Burgess model as industries clump around areas of transport like in real life.
The Methods- Pros and Cons
Land Use Surveys
Land use surveys are maps showing an area using different colours to show what the land is being used for, like residential, commercial or industrial. They are very useful for city planners and architects as they show everything, unfortunately they get outdated quickly. They are good though because they can show house prices and land values.
Questionnaires
A questionnaire is a test that you give to lots of people; the idea is for all the questions on each questionnaire to be exactly the same. You normally have multiple-choice questions. They help people find out more about things when they only want a certain amount of answers.
I’m going to use questionnaires to question pedestrians about my five sites, asking questions like “is it normally like this?” and “how often do you come here?”
The bad side of questionnaires is that you have to plan them out very well to incorporate all the possible answers and so your questions have points relative to the main objective.
Traffic counts
Traffic counts are where you count the amount of traffic going past you in a certain amount of time; I’ll use 10 minutes. You tally it and then put it in numbers afterwards. This can be inaccurate though, especially on busy roads and motorways. It is quick to do which is a plus, and using more people to count the different types of vehicles will make it more accurate.
Environment Surveys
These are like land use surveys but show environmental aspects, like pollution and forested areas. They can be useful to see where people live and if pollution will bring down a house value. These can be especially useful to people looking to buy a house or land.
Photographs
Photographs are very useful as second hand information because you can see something exactly as the other people would of. They are also easy to take but if you don’t have a digital camera can be hard to view.
Field sketches
These are good to remind yourself of what something looks like more then show someone, as most times they won’t look that much like what they are of. They are quick to make and easy to carry around with you but are hard to make in rain, wind or other bad weather conditions.