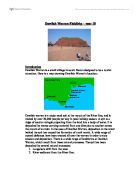
Whether human or natural processes affect the coastline in Dawlish
GCSE GEOGRAPHY COURSEWORK
By Nick Simm of 11I
Dawlish Warren is a small town very near Dawlish.
The main aim of my enquiry is to find out whether human or natural processes affect the coastline and in what circumstances, to discover this information I will perform tests in three different locations, known as location A which is the Langstone Rock, location B which is the amusements or café and location C is the spit.
I have decided to write a section about sea defences on the Dawlish Warren because I think this is an important factor to consider while global warming is concerned because Increasing sea levels could mean flooding, this means sea defences are required.
Here is a table I wrote up so you can see some of the things I will talk about in my Introduction: (fig 1.0)
Tourism
Wind direction
Nature reserve
Fetch
Golf course
Constructive waves
SSSI - Site of special scientific interest.
Destructive waves
Beach/sea defences
Erosion processes
Transportation
Deposition
On the next page there is a map of Dawlish Warren so you can get an idea of its surroundings.
MAP OF DAWLISH WARREN: (fig 1.1)
Below are various sea defences I discovered on the internet and in Geography class.
Sea Defences
The sea wall
The sea wall is usually made out of concrete or stone and reflects waves and withstands a wave breaking on it. Costing £6,000 per metre.
Well-angled beach
The best sea defence ever is a well shaped beach It will adjust and absorb wave energy and the best thing of all is that it costs nothing, the only downfall is that there could be erosion during storms and that will need to be looked out for.
Beach nourishment
It will replace sand lost by erosion each year and it costs £3 per cubic metre.
Offshore breakwater
Offshore breakwater stops waves going offshore it costs roughly £5,000 per metre.
Rock armour (rip rap)
Built in 1997, many repairs since large interlocking boulders, £3500 per metre.
Concrete revetment
Sloping concrete wall, created to stop sea smashing up into the land in high, stormy and unpredictable weather. Costing £2000 per metre.
Gabions
Stones in wire basket with partial cover by sand and grass
DAWLISH WARREN TOURISM:
Tourism does well at Dawlish Warren; there are a variety of different shops for the tourists to explore like the coffee shops and the arcade, which can earn a lot of money from punters and the general public. Dawlish Warren is a big enough place the beach is pretty massive, so tourists are rarely cramped. At location A, the coast was practically deserted! But as we ventured towards the shops, arcade etc it started to get very busy, this shows that the tourist industry is doing very well, because it manages to attract visitors away from the beaches and towards the shops, although Location B was fairly well populated it wasn't so that people became cramped, it was very spacious. Unfortunately our group came across a few dead fish and quite a bit of rubbish (at Location B), this shows that the area is under threat of pollution.
SPITS
The spit at Dawlish Warren formed from the land originally having LSD moving large amounts of material along the beach when there is a sudden change in the direction of the coastlines, when the sea is relatively shallow and becomes progressively more sheltered.
WIND DIRECTION
The wind direction came from the southeast, which I thought was very unusual. The wave direction came from the south/south east. The fetch was a mere 40 - 50 miles (from France). High-pressure 1032mb is little wind. It was a fine and clear, hot day that means LOTS of tourists will visit. The waves were fairly small, which means they are constructive.
EROSION PROCESSES
EROSION
Erosion is the general term for the processes by which the surface of the earth is constantly being worn away. The principal agents are gravity, running water, near-shore waves, ice (mostly glaciers), and wind.
FREEZE THAW ACTION
Freeze thaw action is where rainwater falls into cracks of rocks and when it gets to winter the water freezes and expands making the rock split.
CORROSION
Corrosion is where rain falls into land where there are chemicals making the water slightly acidic, this makes the limestone erode away.
ABRASION/CORRASION
Abrasion/Corrasion is the wearing away of cliff by the waves hurling material at it.
CORROSION/SOLUTION
Corrosion/Solution is the dissolving of limestone and other materials by the sea (salt).
ATTRITION
Attrition is the wearing down of broken materials into smaller rounded particles.
SUB AERIAL
Sub aerial is surface run-off, weathering-wind frost.
HUMAN ACTIVITY
Surface run-off is increased, sea defences.
WAVE POUNDING
Shock waves of up to 30 tonnes/m2
FEATURES OF COASTAL EROSION
Arch:
An archway formed where a cave has been eroded through a headland.
Stump:
A rocky outcrop covered at high tide. It is the eroded remains of a stack.
Sea cave:
A sea cave is a hollow in a cliff face formed by the sea eroding a point of weakness (often a joint) in the rock.
Cliff:
A cliff is a steep, high rock face on the coast. Formed where a ridge of high ground meets the sea.
Stack:
An isolated pillar of rock formed when the roof of an arch collapses.
Wave-cut platform:
A wave-cut platform is a gently sloping platform of rock at the base of a cliff, running out to sea. It marks the earlier position of ...
This is a preview of the whole essay
Sea cave:
A sea cave is a hollow in a cliff face formed by the sea eroding a point of weakness (often a joint) in the rock.
Cliff:
A cliff is a steep, high rock face on the coast. Formed where a ridge of high ground meets the sea.
Stack:
An isolated pillar of rock formed when the roof of an arch collapses.
Wave-cut platform:
A wave-cut platform is a gently sloping platform of rock at the base of a cliff, running out to sea. It marks the earlier position of the cliff and is covered at high tide.
Cliff fall:
A cliff fall is a landslip due to the cliff being under-cut by the sea.
Joint:
A joint is a vertical crack in a rock, joints in a cliff are often the target for erosion by the sea.
At Dawlish warren I will have a 3 of different place to analyse. Location A - Langstone rock, Location B - The main beach between the railway bridge and the visitors' centre, and Location C - The spit and Dunes.
I have roughly an hour to investigate and collect information in each location
BELOW IS A PHOTOGRAPH OF LOCATION A (fig 1.3)
BELOW IS A PHOTOGRAPH OF LOCATION B (fig 1.4)
BELOW IS A PHOTOGRAPH OF LOCATION C (fig 1.5)
To complete my task I must:
First go to Location A; on my way I must analyse the following:
. Look at the jumble of boulders on the seaward side of the path and write about them.
2. Suggest why the headland is detached from the coast.
When I am there I need to do a number of things:
* Find evidence of both natural and human influences on the cliffs beach.
* Suggest what features have been produced.
* Suggest any human activity
* Suggest the effects in may have had.
* Estimate the volume of the sea caves.
* Analyse the Langstone rock cliffs.
* Analyse the cliffs behind the sea wall.
* Conduct surveys and experiments on the beach.
* Conduct experiments on the waves.
* Analyse the sea wall.
* Analyse the breakwater.
* Chill out in the sun.
Next I must head to Location B; while I'm there I must:
* Analyse coastal protection.
* Analyse the beach.
* Check for other human influences.
* Observe the visitors centre.
Now I must head to Location C; while I'm there I must:
* Analyse the waves.
* Create a beach profile
* Analyse the beach.
* Observe the Dunes
* Explain why so much money has been spent on this part of Dawlish Warren.
For my methodology I will first produce a base map of each location:
Location A base map: (fig 1.6)
LOCATION B BASE MAP (fig 1.7)
LOCATION C BASE MAP (fig 1.8)
DESCRIPTIONS OF THE METHODS OF DATA COLLECTION
For my data collection I did a beach survey of age/sex population on the beach for each location, also I did an activity survey. I did a visual interest survey for each location, a wave count for each location. I did a distance, depth change, and material survey. I don't think we encountered any real problems whilst collecting our data, apart from one, the beach profile. When we were measuring (me and Richard Grant) a few members of the group ran off to 'play' in the rock hole, and wouldn't come back for ages wasting valuable time!
Almost all the data we collected was primary it was mostly from the beaches we analysed and measured, produced surveys on etc.
First, before I undertake the experiments I must plan some of the things I will do:
Beach Profile:
For my beach profile I must use the following equipment:
Metre Stick,
30cm Ruler,
Spirit level,
Method
- I must place the metre stick on the ground as flat as possible.
- Use the spirit level to make sure it is totally flat.
- Use the 30cm ruler to measure the gap.
- Record my results in a table and construct a graph as a secondary example.
LSD:
LSD (Long Shore Drift) is where you measure how far something floats in a certain direction, so basically how far the shore 'drifts'. To measure this we will most likely use an apple or something similar, toss it into the water and measure far it drifts in a certain time using foot-steps to measure the distance. Write up my results in a table and graph.
Cave Measurements:
For the cave measurements I must measure the width, the height of the cave, then use a mathematical formula to calculate the area of air, then I know how much it's eroded.
Graphical content:
This will be sketch's, photographs and any other graphical evidence I can get my hands on, this should back up my written work.
Visual Interest Survey:
For my visual interest survey I will draw my conclusions up in a table and possibly convert that to a graph. I must think about noise pleasant-ness, planned-unplanned etc.
Beach Quality Survey:
I will draw up my conclusions (very similar to V.I.S.) in a table and (again) possibly convert them to a graph. I must think about area for games, the landscape, reliability of rocks etc.
Groin/Sand Heights
With our 30 cm ruler, we will measure the height of sand deposited on each side of the groins, the data will most likely displayed in a table.
Below are some pictures of Location A, so you can get a good idea of its layout and surroundings:
LANGSTONE ROCK (fig 1.9)
THE CLIFFS OF LANGSTONE ROCK
NATURAL INFLUENCES:
* Barnacles on sea wall
* Freeze thaw action occurring on the Langstone rock, which will crumble away at the sandstone.
* Caves created from erosion; waves, stones and sand smashing against the rock.
* Stones and pebbles, caused by erosion from the cliff.
* Wildlife such as flora on rock, observe flora text below:
THE WILDLIFE OF LANGSTONE ROCK
Langstone rock, a cliff of red sandstone which grows various plants uncommon on or absent from the Warren itself, for example Danish scurvy-grass is abundant beside the rock armour of the sea wall, beside the railway line. Rock Sapphire is locally common and on the rock itself grows Rock sea lavender. (At the root of Langstone rock lie rock pools rich in seaweeds rich in seaweeds and marine creatures). However, Langstone Rock and other areas outside the true warren have not been systematically surveyed for this flora and no specific records are included. References to its plant life are circumstantial only.
HUMAN INFLUENCES
* The sea wall
* The railway
HUMAN ACTIVITIES
* People walking across beach
* People sitting on beach
There appeared to be no affect on the area from these human activities.
Annotated sketch and photograph of arch: (fig 2.0)
LANGSTONE ROCK TYPE
The rock type is sandstone and has a very crumbly texture it also has a lot of nooks and crannies. There is an arch running straight through the right side of the rock.
CLIFF HEIGHT
The Cliffs height is 20 metres.
BEACH QUALITY SURVEY (fig 2.1)
FEATURE
SCORE
Water
2 - cloudy water
Sand
2 - Dirty Sand
Cliffs
2 - Some unstable
Bathing
2 - Rocks mud makes bathing difficult and/or unpleasant
Noise
3 - Peaceful and un-crowded
Area for games
2 - Some space for games.
View
2 - Reasonable
Seaweed
3 - No seaweed
Natural interest
3 - Much
Wind shelter
3 - Sheltered from the wind
Litter
2 - Some litter
The table above shows that the beach has a total score of 26. This is quite good as on no occasion does it score less than 1. The natural interest feature was so high because it is a fairly enclosed area which means lots of rock pools and other natural features. The crowds tend to head for the huge wide beaches where the sand is white and the sea clear, with no rocks in it. This makes this area quite peaceful and un-crowded. Surprisingly there was not much sea-weed at all in the area. I would have thought there would be a lot more because of the rock pools and other natural features.
There is some litter which spoiled the location a little bit, but unfortunately all beaches will have some litter on because of the lack of care from some people who go to the beaches, usually tourists. The area is very sheltered from the wind because of the high cliffs that stop large amounts of wind from gusting through; unlike the larger beaches. But because of the fact that it is fairly enclosed the view suffers considerably. You won't have much of a range of site. Unfortunately some of the cliffs were particularly dangerous and looked on the verge of possible collapse, this could be quite dangerous and was a major downfall to the beach. The sand was quite dirty, well not really dirty it was muddier sand instead of clear white sand, which is another reason why this beach was less popular. Also bathing proved rather difficult/unpleasant because of the enclosed view, but because of the wind being sheltered by the cliffs it is slightly warmer than some of the other beaches, the problem is; the majority of the wind comes from the tide so the cliffs wont save you then anyway.
The graph below (fig 2.2) comes to the same conclusions as the paragraph above.
VISUAL INTEREST SURVEY (fig 2.3)
Pleasant
V
Unpleasant
Interesting
V
Boring
Colourful
V
Dull
Peaceful
V
Noisy
Natural
V
Un-natural
Beautiful
V
Ugly
Tidy
V
Un-tidy
Healthy
V
Un-healthy
Planned
V
Un-planned
5
4
3
2
That made no sense to you? Okay, here goes:
* Pleasant is how nice it is to be there, the atmosphere.
* Interest is what unusual features there are
* Colourful, is bright sections
* Peaceful is how noisy it is or not
* Healthy is how clean the water is and how clean the beach is
* Planned is how much thought has gone into it
GRAPHED VERSION OF FIG 2.3 (fig 2.4)
Pollution table
Pollution
Yes or no
Drift wood, plastic bottles etc.
V
Metal cans
V
Rope, string, fishing wire
X
Dead fish
X
The pollution at Location A could easily have been better; after all its only a very small beach so it wouldn't take long for someone to go along the coastline picking up metal cans and drift wood.
Beach use survey - Location A:
0 - 10
1 - 20
21 - 40
41 - 60
60+
Male
VVVVV
VVVVV
Female
VVV
VVV
Playing with sand
Picnic ball game
Sun bathing
Walking
Reading
Eating
VVV
VVV
V
VVV
VV
VVVV
There weren't many people at this Location because it isn't good for general family purpose because of the small size and rock-ridden coast. But the people that were here were mainly just eating... The results were fairly mixed of what people were doing, not many people sunbathing, probably because the beach is so interesting!
Location B, I found disappointing as there were a number of dead fish along the coastline, this made me think about the possibilities of water pollution and people swimming in it maybe getting ill. Below are some pictures of Location B
SKETCH OF LOCATION (fig 2.5)
BEACH QUALITY SURVEY (fig 2.6)
Feature:
Rating:
Sand
3 - clean and golden
Water
2 - Cloudy
Cliffs
3 - Stable cliffs
Pebbles
- Many pebbles
Bathing
3 - Safe bathing
Noise
2 - Some people and or noise
Area for games
3 - Large
Scenery
3 - Attractive
Seaweed
- Much
Natural interest
- Little
Shelter
2 - Open to wind
Litter
2 - Some
GRAPH FOR FIG 2.6 (fig 2.7)
DESCRIPTION OF FIGS 2.6 AND 2.7
These results show us that Location B is the lowest scoring beach out of all three, scoring an average 26 points, in comparison with Location C which scored 30 points it isn't too great but Location A only scored 26 points as well.
The water is fairly cloudy, this confused me because most beaches with cloudy water should be fairly enclosed by rocks, so when the waves smash against the rocks it makes all the sand swirl, making it look cloudy. The sand was clean and golden; this was one of the reasons why this beach is the most popular with the visitors. Another is the fact it is very near the tourist area, where there is shops and a food bar.
There were no cliffs nearby, so the chances of someone getting hurt at this location were quite remote indeed. Unfortunately there were many pebbles, which could put people off, but all the locations at Dawlish warren suffered from this problem. The bathing is also very safe, but could be dirty and smelly; there were dead fish around. This location being the most popular brings problems along with the people, this was the noisiest location at Dawlish warren. The area for games was nice and big, because of the large expanse of the area. The view, unfortunately, was nothing special really, but I'll go as far as to call it reasonable.
Unfortunately there was a huge amount of seaweed in the area and not much natural interest, which might put people off. There isn't much shelter because of the lack of cliffs, also there seemed to be a fair bit of litter around; not surprising really as this location is visited frequently by tourists.
Pollution Table (fig 2.8)
Pollution
Yes or no
Driftwood, Plastic bottles etc.
V
Metal cans
V
Rope string and fishing wire
V
Dead fish
V
Unfortunately Location B was quite dirty and scored the worst score for pollution. There were several dead fish lying on the shoreline which points towards the possibility of polluted water. In fact it wasn't only dead fish that we found on this beach; we found fishing wire lying around, Metal cans where someone could fall over and hurt themselves, driftwood and plastic bottles. Improvements recommended:
* Find out what is wrong with the water and prevent further 'contamination'.
* Make sure people aren't careless on the beach and don't leave things behind by putting up signs warning people of possible fines.
* Warn fishermen in the same way.
Wave Count for Location B (fig 2.9)
Time
How many waves
Height
sec
1
40 cm
Beach use survey (fig 3.0)
0 - 10
1 - 20
21 - 40
41 - 60
60+
Male
VVV
VV
VVVVV
VVV
VVV
Female
VV
VV
VVVVV
VV
V
Playing with sand
Picnic
Ballgame
Sun bathing
Walking
Reading
Eating
VVVVVVVVVV
VVVV
VVVVV
VVVVV
VVVV
Because this location didn't have much in the way of sites; the beach was far too big and mainly the same all the way along, so there weren't many people walking about.
Most people were actually fairly stationary, either reading, playing with sand, eating or sun bathing. (This could have been because of the presence of dead fish in the area).
Location C was definitely of the better beaches out of the three, the pollution was less than both the others and the sand was brilliant; very white.
Below are some pictures of Location C
SKETCH OF LOCATION (fig 3.1)
BEACH QUALITY SURVEY (fig 3.2)
Feature:
Rating:
Sand
3 - clean and golden
Water
3 - Clean, clear water
Cliffs
3 - Stable cliffs
Pebbles
- Many pebbles
Bathing
2 - Rocks could make bathing un-pleasant
Noise
3 - Peaceful and un-crowded
Area for games
3 - Large
Scenery
3 - Attractive
Seaweed
3 - No seaweed
Natural interest
2 - Some natural interest
Shelter
2 - Open to wind
Litter
2 - Some
Description:
Location C scored a total of 30, higher than both Location A and Location B. There were less natural features than at Location A though. The sand was clean and golden, very small grains, this portrays the age of the beach. The water was also very clean and clear which shows that not many people have been in the area and links to the fact that the beach is peaceful and un-crowded. The cliffs were stable. Unfortunately (or fortunately for some) there were quite a few pebbles around which suggests a young beach, but where there were pebbles was where water from the shore couldn't get to, to break it up. There are also areas with some rocks around which could make bathing difficult, but because the beach was so un-crowded there'll always be room for bathing on the sand. There is a very good area for games. The scenery was also very serene and calm, which was all naturally formed. The shelter is fairly open to the wind from the lack of cliffs. There is some litter around but not much, this is caused from human influences (obviously).
GRAPH OF FIG 3.2 (fig 3.3)
PIE CHART OF FIG 3.2 (fig 3.4)
GRAPH CONCLUSIONS
From creating a graph I can begin to see clearly what feature is top at this beach, we can see that pebbles has the worst score, so the beach needs to be improved in that respect, but pebbles are part of this Locations identity so it would be wrong to remove them, besides its against the law.
VISUAL INTEREST SURVEY
Pleasant
V
Unpleasant
Interesting
V
Boring
Colourful
V
Dull
Peaceful
V
Noisy
Natural
V
Unnatural
Beautiful
V
Ugly
Tidy
V
Untidy
Healthy
V
Unhealthy
Planned
V
Unplanned
5
4
3
2
On this Location it didn't score less than three at all which was very good, but it didn't score five at all. Below are some graphs to better portray my results...
ANALYSIS OF LOCATION
This area has lots of sand dunes around the they are created from sand being blown into a pile, allowing plants to grow, as this procedure repeats itself more and more dunes are created allowing new and different plants to grow there. The dunes have a height of around 10 metres, and they are defended from the sea by being quite far away, also they have stones with wire mesh tied over them to stop it being washed away if there was freak weather and the sea reached the dunes. But there is still the possibility that they will be swept away in high winds by the sea, the wire mesh and stones isn't going to protect the dunes from all circumstances. Things like sudden climatic change and vegetation growth could affect the dunes too. Some human (and dogs) influences that may affect the dunes:
* Children; tearing up the plants,
* Dogs trampling the plants and urinating on them,
Some areas of the dune are out of bounds because of special wildlife having a habitat there. Also the wire mesh and stones prevents the dunes being blown away, washed away, and worn away.
Also a lot of money has been spent protecting this area of the Warren, this is because it is a SSSI (Site of Special Scientific Interest) and an area of public interest. It is a good idea because it provides and area for wildlife and maintains the biodiversity.
My original aim was to find out whether human or natural processes affect the coastline and in what circumstances, I think this aim was easily achieved and now I think I know just about everything about Dawlish Warren!
The main human influences were people walking on and around the beach and littering. The main physical features were:
* The weather
* The sea
* The moon
* The rocks
I believe that the moon influences the shape of the coastline due to its gravitational pull on the waves. The sea also influences the way the rocks are shaped at Langstone Rock because it smashes sand and pebbles against it. This form of erosion is called Wave Pounding.
The rocks are the main contributors in Wave Pounding as they are what smash in to the Rock making arches and sea caves. The weather is used to control wave speeds thus speeding up the Wave Pounding process.
I think on the whole most of my fieldwork techniques went well, although on the day we didn't have time to complete the gruelling beach profile. All our surveys were particularly successful and we achieved very reliable results. My Long Shore Drift measurements didn't go according to plan, simply because we didn't have enough floating materials, like tangerines etc. We could have improved via bringing more tangerines. Our conclusions were limited because we have no beach profile, which could have been very useful for proving the way the beach is sloped. If I went back there at a later date I may have the chance to improve my enquiry, but it is unlikely. I am quite pleased with the fact that I managed to collect so much data and present it in a number of different ways and be able to talk about my results, I think I achieved my main aim, which was to 'find out whether human or natural processes affect the coastline and in what circumstances'.