All those that died at Croydon Airport were male and the average age was 30 years old. This is supported by the fact that the source says “the raid on Croydon, by now a fighter station”. Many of those that died at the airport were almost certainly RAF personnel. Those that died at the N.S.F factory were predominantly male, however there were also 6 females. The average age was also 30 years old. This source is evidence of those early Luftwaffe attacks on RAF bases. It is also a good example of the inaccuracy of bombing and the affects it had on the civilian population.
Another major consequence of the air raids apart from loss of life and its widespread effect was the damage that it caused. An initial newspaper source depicting the damage sustained by the Whitgift Almshouses is a very good example of this. It shows that damage that the bombing caused. It is also a good example of a typical newspaper source. The government strictly censored the newspapers and as a result of this censoring, the information in the articles is often limited. They also show a strong emphasis on boosting morale, for example in this source the heading is “345 years old – can still “take it”. Also at the bottom of the caption there is a sentence that reports on six fatalities and twenty-five casualties nearby. However this seems to have been added as an after thought and is not meant to draw the reader’s attention. It suggests that it needs no explanation. This is the result of the government’s strong control of the papers. It is to try and maintain high morale. This is reflected in the fact that many newspaper articles focus on survival stories and other morale boosting topics.
This type of property damage was common and it is shown in a source from my extended research “A Comprehensive report prepared by the Special War Executive Committee of Surrey County Council – 1945”. This source is extremely detailed and contains information about property damage. It states that throughout the war in Croydon alone, 2323 houses were demolished and over 95000 houses were damaged by bombing. These figures are much higher than any other borough in the area. For example in Banstead only 97 houses were destroyed and 5891 were damaged. These high statistics may have been due to the fact that Croydon had an active RAF aerodrome during the beginning of the war. This would have attracted more attention than industrial areas in other boroughs. This source is extremely useful as it gives hard statistical evidence for the bombing of Croydon throughout the war. It is published after the war as a “comprehensive” report, which suggests that many different sources have been compiled into one very factual report. The report is likely to be accurate as it is a report published by the Council and is unlikely to be censored. It has been published to remind the people of what they have achieved by surviving the war and also as a chance to remember all those who perished.
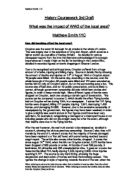
These figures are supported by another source from my extended research, which is an index for a catalogue of bomb photos. The street names and numbers are given where possible and the date is also given. From this information I can conclude that all of the affected houses were in Croydon and many houses were pictured together at the same time. This is due to the fact that there are many groups of photos from the same date on the same street as one another. Out of a total of 125 houses the dates of 3 were unknown, 1 was from 1940, 21 were from June 1944, 84 were from July 1944 and 16 were from August 1944. Although this source does not include the photos that it catalogues, it is complete and detailed. Often giving not only the street name and number but also the full date. This source can be used to show the spread of bombing over the area of Croydon and at which times they were bombed.
2.4% - ?????
0.8% - 1940
16.8% – June 1944
67.2% - July 1944
12.8% - August 1944
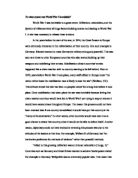
With the heavy bombing there were bound to be casualties and as a report shows, casualties were also very high. There is a link between casualties and property damage. This suggests that the casualties suffered by Croydon were also high. The report contains a table of casualties and bomb figures. Croydon suffered over 55% of all fatalities in the area. It also suffered 50% of all serious injuries and 64% of all slight injuries.
The fact that Croydon itself was hit very hard by the air raids, in some cases over twice as hard as neighbouring boroughs. Out of the total number of H.E bombs that hit the area, over 40% landed in Croydon. The percentage of flying bombs that landed in Croydon was 32%. This suggests that there is a definite link between property damage, casualties and the number of bombs. This is due to the fact that the bombing not only caused casualties but it also destroyed large amounts of property.
A newspaper article on “The Impact of flying bombs” supports these figures from the report. The article claims that Croydon is “The worst-hit borough in Greater London”. It also states a few figures; these figures are similar to those published in the report. For example the newspaper article claims that 141 flying bombs fell on Croydon and the report claims that 144 bombs fell on Croydon. These slight discrepancies may be explained by the fact that the newspaper article was published before the report. Newspapers were also heavily censored by the government and were highly selective in the material they published. This may have attributed to the discrepancies.
From all of the information I have collected from both my initial and extended research it seems clear that Croydon was definitely one of the worst affected areas in London. As the reports show with Croydon reporting over 36% of the total number of bombs in the local area. This is most likely due to its major communications point, Croydon Airport, which resulted in it being the most heavily bombed borough. This was due to the Luftwaffe’s concentrated attacks on RAF bases and communications points in the early stages of the war.
1462 Words