Comparing my results
As you can see from the three different searches I did with different search engines, all of them came back with different results. Google had the most results relating to the house price data. So the most appropriate search engine for me is the text base search which is Google.
Using logical operators (AND, OR, NOT)
Logical operators are AND, OR and NOT. These are used to add precision to searches that people make when using a search engine. Using the AND operator narrows down the search. When you add more words to it the narrower the search becomes. The OR operator widens the search. In the Google search engine it isn’t necessary to enter the word AND between search words because Google includes all the search terms entered by default. Google also uses the minus sign to represents the NOT operator.
Effects of using logical operators
Advanced search options:
This is another way of adding precision to searches. The advanced search is offered by many search engines, the search engine that I am going to be looking for the advanced search option is Google. Some of the options in Google's search engine are the same as using the logical operators which I have stated above. The option 'with all the words' is the same as the AND operator. The option 'with at least one of the words' is the same as using the OR operator and the 'without the words' is the same as using the NOT operator.
As you can see from the screen shot I have taken, I used the Google’s advanced search in order to find what I am looking for. The option ‘with all these words’ I entered in house price and data again this is the same as using the AND operator for the logical operators. I also entered the word ‘excel’ in the option ‘one or more of these words’ again this is the same as the OR operator. In the option with ‘any of these unwanted words’ I put ‘news’ many of hits relating to my topic comes back with news so to narrow down the search I didn’t want any aspects relating to news.
I found a link which was the nationwide website; it has data relating to house prices. The nationwide website is an on-line database which has its own Internal search engine. When a user has entered the site, the site offers a range of different options to choose from as shown below in the screen shot:
As you can see from the screenshot it has three options that are drop down boxes. I used the ‘UK series’ option and chose data from 1952. I chose this data because it has accurate data from the past 50 years and has long range data which can be analysed. The data that I downloaded from this on-line database was in Microsoft excel.
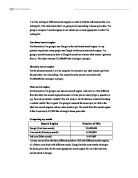
House Price Data in Excel:
As you can see from the screen shot the data is set out in four different sections which I have highlighted on in the screenshot. The first section is all houses, the second section is the new houses, third section is modern houses and the fourth is older houses. I will be using different functions in order to do some analysis to this data.
I created a graph using the data I got from the spreadsheet. I took every forth column for the first 10 years to generate some analysis.
As I stated above the nationwide data had four sections one of which I did a graph on in the screenshot above. I decided to take every ‘Q4’ of the three sections and compare them. I compared ‘new houses’ with the ‘modern houses’ and the ‘old houses’. Again I only took the years from 1952 to 1961 because of the large amount of data within the nationwide.
As you can see from the screenshot on the right the three different house sections are quite close together. The ‘New houses’ has the best increase then the other two.