Aim: in this task, you will investigate the different functions that best model the population of China from 1950 to 1995.
Steven Burnett IB Year 1 SL Type II
Aim: in this task, you will investigate the different functions that best model the population of China from 1950 to 1995.
Data on the population of China from 1950 to 1995:
Variables and parameters:
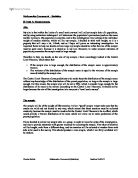
- The graph above is the data for China's population (in millions) plotted as a scatter graph. The population is clearly increasing as the years increase, seemingly at a steady rate similar to that of a linear progression.
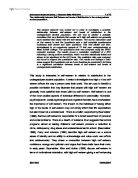
Linear trend line:
- The above graph now has a linear trend line (with the equation of f(x) = 15.5x – 29690.25). Although it is very close to each point, it isn't perfect (for example, the data for 1950 and 1965 hardly touch the line). Furthermore, this model predicts that China's population would simply increase at a constant rate – which is unlikely since it is expected that a population would increase exponentially, in an ideal world.