Results
By measuring the length of the foot and the hand span, quantitative rather than qualitative data has been obtained and recorded in tables, charts and graphs. This way the results have been displayed in forms in which any correlation is clearly visible. To determine whether there is correlation between hand span and foot length in humans, several statistical techniques have been applied. For example, Spearman's Rank Correlation Coefficient has been used to determine whether correlation is present, positive or negative and its associated strength. Scatter graphs have also been used to illustrate any correlation graphically so that any relationship will become clearer and more obvious. By using frequency distribution graphs the nature of the variation involved in the foot length and hand span will be examined and determined.
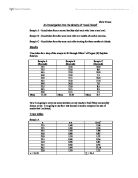
The data gained from the sampling of one hundred individuals (fifty male and fifty female) has been tabulated in Appendix 1-Table 1 'Male and Female Hand Span/Foot Length Results' and plotted in the Graphs 1-11. Selected data has been reproduced in the summary table 'Summary of main results' below so that the most important results and trends are clearly visible and can be analysed more easily.
Summary of main results
The 'Range of data' gives the highest and lowest values of the data recorded in the investigation.
Appendix 2-Graph 1 - 'A scatter graph to show the correlation between hand span and foot length', contains the results of the measurements of both the males and females of the one hundred individuals sampled. A trend line has been plotted to gain a clearer indication of the correlation between hand span and foot length. The trend line shows very clearly that there is strong correlation between hand span and foot length with the larger hand spans occurring with the larger foot lengths. Although there is a wide variation, the points are clustered closely around the trend line indicating strong correlation. The points on the graph appear to be clustered in two groups one around a hand span of 16-20cm and the other from 20-24cm. This has been highlighted on a copy of the graph below:
This may indicate a divide between the foot length and hand span of males and females.
Appendix 3-Graph 2 is a scatter graph plotted with the data gained from female individuals. The trend line shows clearly a strong correlation between their hand span and foot length. Although some anomalies are present e.g. a hand span of 21cm and foot length 23.5cm, the majority of points are clustered closely around the trend line increasing the significance of the correlation.
Appendix 4-Graph 3 is a scatter graph plotted with the data gained from male individuals. The trend line plotted from the data demonstrates a clear positive correlation between their hand span and foot length. Although there are anomalies present similar to the data in Appendix 3 Graph 2, such as the measurement of hand span 21.4cm and foot length 25.9, the points are closely clustered around the trend line. This illustrates a close link between the two measurements.
One way of measuring the amount of genetic variation in a population is to plot a frequency distribution graph. This shows the frequency of a characteristic plotted against its value. Graphs 4-11 are frequency distribution graphs showing the variation of hand span and foot length of the individuals sampled in this investigation.
Appendix 5-Graph 4 is a frequency distribution graph plotted with the total data gained for the hand spans of the individuals in this investigation. The graph although unclear, displays two peaks. This is not clearly visible due to the greater variation of female hand spans but it is apparent in Appendix 6-Graph 5 'A frequency distribution graph to compare the variation of hand span amongst males and females'. The two peaks display a normal distribution and indicate a divide between the sexes where males have bigger hands than females.
Appendix 7-Graph 6 'A frequency distribution graph showing the variation of hand spans of females' shows a wide variation of hand span measurements. The hand span measurement of the greatest frequency is 18.5-19.5cm and there is a general bell shaped curve in the pattern of frequency distribution with fewer individuals with hand spans of the extreme values 14.5-15.5cm and 22.5-23.5cm and a greater frequency of hand spans at the middle of the range of measurements.
Appendix 8-Graph 7 'A frequency distribution graph to show the variation of hand span of males' shows a clear pattern of distribution. The range of data is much narrower for the hand spans of males rather than females but shows a clear 'bell shaped curve'. There is a distinct peak at a hand span measurement of 21.5-22.5cm and distinctly lower frequencies at the extreme values.
Appendix 9-Graph 8 is a frequency distribution graph illustrating the total data obtained for foot length measurements. It shows a wide variation of measurements and contains two peaks. These peaks are much more clearly defined on Appendix 10-graph 9 'A frequency distribution graph to compare the variation of foot length amongst males and females'. These two peaks reveal a difference between the foot length of males and females and that in general males have bigger feet. The two peaks show continuous variation with main peaks containing the highest frequency at middle range values and low frequencies at the extreme foot length values.
Appendix 11-Graph 10 is a frequency distribution graph plotted with the data obtained for the foot length of female individuals. It shows that the majority of those sampled had a foot length of 23.5-24.5cm and no females sampled had measurements lower than 22.5cm or greater than 27.5cm. The distribution of the data is roughly a bell shaped curve with one main peak with the greatest frequency at middle of the range measurements and the lowest frequencies at the extreme values.
Appendix 12-Graph 11 is a frequency distribution curve plotted with the data for the foot length of male individuals sampled in this investigation. The data illustrates the fact that the majority of those sampled had a foot length of between 27.5 and 28.5cm. This figure is much greater than the average female foot length measurement indicating that in general males have larger feet than females. The data obtained from males was of a much narrower range (26.5-29.5cm) than females which may indicate less genetic variation. The distribution of data in the graph is one main peak at the middle of the range (27.5-28.5cm) and much lower frequency at the extreme values (26.5-27.5cm and 28.5-29.5cm) indicating continuous variation.
To give the correlation between foot length and hand span a precise value and therefore define its significance accurately, Spearman's Rank Correlation Coefficient was used. This statistical technique was carried out by first ranking the data in order of the greatest measurements of foot length and hand span, calculating their difference followed by the difference squared between the ranks of the two measurements. These values were used in the formula:
1 - 6 x Åd2
n(n2-1)
to calculate a numerical value for the correlation and therefore determine its strength, characteristic (i.e. positive or negative) and significance.
1 - 6 x Åd2
n(n2-1)
= 1- 6 x 19711
100(1002-1)
= 1- 118266
999900
= 0.882 (3sf)
The value for the correlation between hand span and foot length is 0.88 which signifies very strong positive correlation.
The Standard Deviation or the data obtained in this investigation is portrayed in the summary table 'Summary of main results'. The Standard Deviation is a number representing the "spread" of a set of numbers around their average value. It is calculated from all the individual deviations from the mean. The standard deviation for the total values gained for hand span was 2.239 whereas as for the foot length this value was 1.406. This means that the data collected for foot length was much more tightly grouped around the average than the data collected for hand span. Comparing the Standard Deviation values for males and female hand spans has shown that females have significantly more variation than males with a greater distribution of data. The Standard Deviation values for males and female foot lengths shows that again, females have a greater variation in this characteristic with the data more spread out from the mean value.
Conclusion and discussion
The results table (Appendix 1), scatter graphs and statistical tests have given evidence to indicate a very strong positive correlation between hand span and foot length. This supports my original hypothesis: ' there will be a positive correlation between an individuals foot length and hand span'.
The frequency distribution graphs have shown that males tend to have a larger hand span and foot length than females. This may be due to males generally being taller and therefore have greater sized bodies, feet and hands.
The frequency distribution graphs and the averages calculated show that hand span and foot length follow a normal distribution pattern. The normal distribution is a continuous distribution, which is symmetrical about the mean. The mean, mode and median of a normal distribution all have the same value. If a frequency distribution graph is drawn for a characteristic that shows normal distribution the result is a distinctive symmetrical bell-shaped curve, called a normal curve (see Diagram 1).
Diagram 1
The graph of a normal distribution is a distinctive bell-shaped curve.
This type of data and graphs have exhibited in the results and show that the measurements hand span and foot length are examples of continuous variation. Quantitative or continuous data such as this gives frequencies with which a continuous random variable takes a value in each interval in a range of values. A continuous variable such as hand span or foot length can take any value within a range and are therefore controlled by strong environmental influences or gene interaction. Environmental influences are infinitely varied for different individuals and will therefore produce variation on a continuous scale. Gene interaction occurs when many or several genes control a particular characteristic. Different genes make different contributions to the total measurement, and some genes may interact so that the contribution of one depends on the presence of another to give a normal distribution pattern. The inheritance of quantitative characteristics that depend on several genes is called polygenic inheritance.
In a future investigation twin studies could be used to distinguish whether genetics or the environment mainly controls these characteristics. The hand spans and foot lengths of identical twins raised together and apart could be recorded and compared to establish the basis of these characteristics.
The correlation between hand span and foot length can be accounted for in three separate ways based on the results of the investigation:
§ Linkage
§ Environmental factors
§ Proportions
Linkage
The correlation in the results of this investigation may be explained with autosomal linkage. If the genes for certain characteristics such as hand span and foot length are located on a single chromosome, they are inherited as a group; that is, during cell division they act and move as a unit rather than independently. The existence of linkage groups is the reason some traits do not comply with Mendel's (recombination of genes and the traits they control).
Proportion
A person with particularly large hands is more likely to have a generally larger body which means that they are likely to have large feet in proportion with the rest of the body. This gives rise to the positive correlation between an individual's hand span and foot length. To gain greater evidence to support this theory, a future investigation could be carried out where the relationship between height or length of femur or radius and hand span could be investigated. These characteristics should also show positive correlation.
Environmental Factors
The environment provides the raw materials for growth. The diet of an individual plays a crucial role in their development and therefore their foot length and hand span. Vitamins are needed by humans and other animals, in small amounts. Humans cannot synthesise all the vitamins they require; those that cannot be synthesized must therefore be acquired in the diet, either from plants or from other animals that can synthesise the vitamin. Because certain vitamins are necessary in certain important metabolic reactions, vitamin deficiency during growth may have a variety of effects including stunting and malformation. These effects are likely to affect both the hands and feet in similar ways so that a person with small hands will also have small feet. Alternatively an individual receiving a good diet during growth is likely to have larger hands and therefore also larger feet producing the correlation shown in the results of the investigation.
The procedures followed in this investigation have led to results showing strong trends that support the original hypothesis. This indicated that the precautions and variables carried out as a result of the design and stated in 'Variables', have created a fair and accurate investigation. However, there are some anomalies and improvements that can be made to create a fairer investigation that in the future would produce even stronger evidence to support my hypothesis. The anomalous results in this investigation are apparent on the scatter graph and I have highlighted them on Appendix 13-Table 2.
Examples of these anomalies include an individual with a hand span 21cm and foot length 23.5. This person has an abnormally large hand span for their foot size, relative to the correlation between the majority of individuals sampled.
There are many explanations that may explain the anomalies in this investigation:
Age - In this investigation I decided to only sample people over the age of seventeen. I did not, however, set a maximum age limit and this may have resulted in some anomalies. The measurement of the hand was the hand span which was measured when the fingers were fully extended. This meant that the measurement relied heavily on the flexibility of the hands being constant amongst all those sampled. This was particularly untrue for the older people sampled, who struggled to provide a true hand span and may have caused the anomalies where the hands were particularly small relative to their foot size. To eliminate this inaccuracy in future investigations, the hand length from the wrist to the end of the middle finger could be measured instead of the hand span.
Mutation - The organism is dependent on the environment for the raw materials for growth, but growth is also regulated internally. Because the size and form of an individual is under genetic control, events such as the rate and site of cell division and the extent of cell enlargement can be affected by mutations. A mutation caused by a random change in the DNA base sequence and therefore an alteration in a polypeptide coded for may result in unusually large or small hands or feet. This random occurrence may have caused anomalous results in the investigation.
Experimental error - Inaccuracies in measuring the hand spans and foot lengths of individuals may have caused anomalous results. For example the majority of people sampled wore socks that may have differed in thickness, causing the foot length measurement to be inconsistent. In a future experiment this flaw could be corrected by ensuring that all individuals were sampled bare foot.
In this investigation, measurements were recorded to the nearest millimetre. The mean value for hand span was 20.3cm and the mean value for foot length was 25.9cm. Each of these values were measured to the nearest millimetre creating a probable error of 20.3cm ± 0.5mm and 25.9cm ± 0.5mm. This leads to a percentage error in this investigation of around2% in every measurement. This consistent level of inaccuracy should not have had a significant effect on the results of this investigation which were needed for comparative purposes on the scatter graphs. The accuracy of this investigation is sufficient to provide strong evidence to support the hypothesis 'there will be a positive correlation between an individuals foot length and hand span'. The anomalies in this investigation, although present, are not adequate to question the results and conclusions. However, in a future investigation an improvement on this accuracy through more precise measuring equipment and other improvements outlined above, might create even stronger correlation and greater evidence to support the hypothesis.