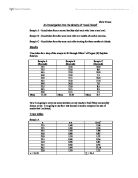
Sample B
Sample C
T-tests
Sample A compared to Sample B
Degrees of Freedom = 18
Variance (S2) = S2A= 2.60
S2B= 2.07
Sample A compared with Sample C
Degrees of Freedom = 18
Variance (S2) = S2A= 2.60
S2B= 2.40
Analysis of t-test
Sample A compared to Sample B
The P value for this t-test was P> 0.1 (P was greater than 0.1). The value means that there is not much difference between the times taken for sample A and sample B. It also means that is a greater than 0.1 chance that it occurred by chance. This makes sense as my research showed me that aerobic exercise only affects the heart and muscles not the density of the blood.
Sample A compared with Sample C
The P value for this t-test however is very different. The value was P<0.001, this means there is a difference and that this out come was not reached by chance. If you did this test again the same result would occur 99.9% of the time. Training at altitude can change the density of the blood. The kidney keeps a constant check on the oxygen in the blood as part of homeostasis and when they are low because you are at altitude a hormone is released. This hormone tells the bone marrow to produce more red blood cells. The more red blood cells in your blood the more dense it is and this showed up in our tests.
Evaluation
I believe that the experiment was accurate enough for the results needed to do our coursework.
There were however some anomalous results, in the test for sample A there was a result of 16.5, which is a full, two and a half seconds slower than the other results. Also in the test of sample B there is a 16 second result that is also much larger than the others.
There were quite a few sources of error in the experiment. Each time the experiment was repeated the droplet changed size. The timing of the experiment was also hard to judge even at eye level, this did have adverse effects on the results as we cant know if the results are correct. After about 5 repeats of the experiment the Copper (II) Sulphate solution became full of floating ‘blobs’ of mock blood, this meant that the last 5 tests of each sample could be affected by them. The recording of the time taken for the sample to fall through the Copper (II) Sulphate solution was not at all accurate. It was fine for our needs but relied heavily on our reaction to seeing the droplet pass the start and finish marks. We used a stopwatch operated by us at eye level with the measuring cylinder. The size of the drop could not be measured either which meant we had variations in that too. The size of the drop would affect the surface area and therefore friction acting upon it; this would slow down the droplet. The shape that was usually a doughnut shape could also change. These are all reasons for my results to be anomalous.
To counter some of these problems we could use other equipment or methods. We could use a light gate that works by detecting a break in a beam of light caused by a blob of mock blood falling through the solution. This would greatly improve the accuracy of the results, as would having two people to record and time the results.
The main sources of error in the experiment were mainly human error in the fact that the person carrying out the experiment controlled the drop size and timing. Most of the time there weren’t any problems with our techniques but errors were still made.