- All of the six main numbers matched (jackpot).
- Five of the numbers plus the bonus number matched.
- 5 numbers matched (not including the bonus ball).
- 4 numbers matched (not including the bonus ball).
- 3 numbers matched (not including the bonus ball).
Analysis of the Lottery Statistics
Sales Statistics
The first attempt I made at finding patterns in the National Lottery was to look at the statistics for sales. This is because these are fairly easy to predict. A table summarising the sales statistics for all of the randomly chosen 50 draws is in Table ?.
There ought to be a correlation between ticket sales and the total number of prize winners (because the more tickets are bought, the more people should win prizes). To check whether this is the case, I carried out the following correlation calculation (All calculated figures in this project, unless stated otherwise, are quoted to 3 decimal places. As many significant figures as possible are used in intermediate calculations.):
H0: There is no correlation between ticket sales and the total number of prize winners (= 0)
H1: There is a correlation between ticket sales and the total number of prize winners ( 0).
Sxx = 1.443 1016
Syy = 5.680 1012
Sxy = 2.445 1014
r = = 0.854
(r is the product-moment correlation coefficient)
Using critical value tables, the critical value for a sample size of 50 at a significance level of 5% (a typical significance level used) is 0.2353,
0.854 0.2353
The correlation coefficient is in excess of the required critical value, I reject H0 and I can conclude that there is a significant positive correlation between ticket sales and the total number of prize winners. The correlation is more obvious when one looks at a scatter diagram of the data, together with a best-fit line. The calculation of the best fit line is below and the scatter diagram is in Figure ?.
y = a + x
= = 0.017
a = - = 1.034 106 – (0.017 5.671 107) = 7.288 104
y = 7.288 104 + 0.017x
The best-fit line has been drawn on the scatter diagram in Figure ? and it clearly shows the pattern – as ticket sales increase, in general, so do the number of prize winners
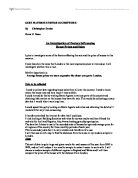
Because the total prize fund depends entirely on the number of sales (as shown in Figure ?, 45% of the revenue generated by people playing the National Lottery goes towards the prize fund), the correlation coefficient for the number of sales and the prize fund should be 1 (if two variables are in direct proportion, the correlation coefficient between them should be 1).
Thus, I checked the correlation coefficient between the number of sales and the prize fund:
H0: The number of sales and the prize fund are in direct proportion (r = 1)
H1: The number of sales and the prize fund are not in direct proportion (r 0).
Sxx = 1.443 1016
Syy = 2.923 1015
Sxy = 6.495 1015
r = = 1
r = 1, I accept H0: There is a direct proportion relationship between ticket sales and total prize fund, as I expected. This is shown on as a scatter diagram in Figure ?, and the diagram in Figure ? is overlaid by a best-fit line, which goes through all the points.
Also if there is a directly proportional relationship between these two factors, the correlation coefficient of total prize winners and the total prize fund should be the same as that between total sales and total prize winners (r = 0.854). I tested this:
H0: There is no correlation between the number of total prize winners and the total prize fund (= 0)
H1: There is a correlation between the number of total prize winners and the total prize fund ( 0).
Sxx = 2.923 1015
Syy = 5.680 1012
Sxy = 1.100 1014
r = = 0.854
I reject H0 – there is a correlation between the number of total prize winners and the total prize fund, and the correlation coefficient is the same as before.
The Numbers Chosen by the Lottery Machine
Another test I performed was to see whether there was any correlation between the number chosen by the lottery machine for each of the balls (1st ball drawn, 2nd ball drawn, etc., up to the 6th ball chosen), and the total number of Lottery winners that week. One might expect some correlation, if, for example, people in general tend to pick lower numbers. The data for the balls chosen, and the total number of winners each week, is presented in Table ?.
I found the product-moment correlation coefficient between each ball drawn (1st drawn, 2nd drawn, and so on up to the 6th ball drawn) and the total number of prize winners. The calculation is not given, but it was performed in the same way as before. The resulting correlation coefficients are given in Table ?:
Next I tested the correlation coefficients I had found:
H0: There is no correlation between each ball drawn and the total number of prize winners.
H1: There is a correlation between each ball drawn and total number of prize winners.
The critical values for n = 50, at the 5% level are 0.2353 (found from tables).
See Table ?
Thus there appears to be a correlation between the first ball drawn every week and the total number of prize winners, although the correlation is only just valid, because the value of the correlation coefficient is very close to the critical value.
The correlation is negative, which implies that the lower the value of the ball chosen as the 1st ball, the higher the number of prize winners that week. This may seem strange, but it can be explained.
One simple explanation, which may or may not be the case, is to do with birthdays: if people pick their birthday dates for lottery numbers, as many do, then low numbers (below 31) are more often picked. When these numbers are selected by the lottery machine, more people will win prizes.
Ball Set and Machine Used
After checking whether the number of prize winners was influenced by the balls drawn, I checked whether there was a correlation between the ball set used and the number of prize winners, as well as the machine used and the number of prize winners. The data for the ball sets, the machine used and the total prize winners for each week are presented in Table ?.
Again, the working is not given for the calculation of the product=moment correlation coefficient, but the coefficients are given in Table ?:
As can be seen, these coefficients are almost 0, and certainly do not indicate any relationship between the factors involved.
Is the Lottery Random?
Theoretically, the balls chosen by the National Lottery machine should follow a uniform distribution. This is what one would expect if the system used is truly random. One can test how well the balls chosen fit a uniform distribution. First I counted the total number of times each ball occurred in my sample of 50 draws. The data is presented in Table ? in a stem and leaf diagram.
Testing the numbers picked in the 50 draws at the 5% level,
H0: The numbers fit a uniform distribution (they are random).
H1: The numbers do not fit a uniform distribution (they are not random).
Expected number of times each ball is picked =50 = 6.122
See Table ?
= 29.0
Degrees of Freedom = y = 49 – 1 = 48
(5%) = 65.17
29.0 65.17
I do not reject H0: there is no evidence to suggest the selection of the first ball is not random.
Conclusions
The Conclusions drawn from this project are summarised below:
- There is a very significant correlation between the number of lottery winners and the number of ticket sales, as would be expected.
- The total prize fund is in direct proportion to ticket sales, as claimed by Camelot, the lottery operators.
- There is a negative correlation between the first ball picked and the total number of prize winners. The pattern suggests picking high numbers would be a good idea to maximise potential jackpot earnings.
- There is no correlation between the ball set used and the total number of prize winners.
- There is no correlation between the machine used and the total number of prize winners.
- There is no evidence that the selection of the lottery balls is not random.