Pilot
In my pilot I will use an article from ‘The Independent’ called ‘Teen music project wins Philip Lawrence award’. The pilot will prove as a test run to point out any abnormalities that may show up later in the investigation and need to be made clear before the investigation starts. The article has 639 words and I want only a small number of words as it doesn’t need to represent the article as it is only the pilot. I will take only 20 words from this article which is roughly 3% of the entire article; this means I will be counting every 32nd word. I will count the number of letters in each word and group them into a chart.
Whilst collecting my data I found a number of areas that need to be addressed that may occur in the main investigation and could affect the outcome of the data one way or another, these include:
- Hyphenated Words – Any two or more words separated by a hyphen are to be counted as individual words.
- Numbers – Any numbers found in numeric form, for example 17 are not to be included in the count, however if the number is written out in letters such as seventeen then it will be included in the count.
- Apostrophes – If a word contains an apostrophe then during the letter count of the word the apostrophe does not count as a letter.
Although the problematic areas have been addressed from this article there may still be areas from the two main articles that would cause problems during the actual counting of the data. In case of this I have read through both articles in advance just to pre-identify any issues, I found the following:
- In the Kerrang article the brand-name ‘Playstation’ will be included in the count; however the abbreviation of this ‘PS2’ will not be included. Also the brand name ‘Xbox’ will not be included in the count.
- In the brand name ‘Guitar Hero II’ the ‘II’ will not be included in the count.
- In the ‘Reveal’ article the abbreviation R&B will not be included during the collecting of data.
Anything other than what is stated above is to be included in the data count. I will now begin collecting my data for my main investigations.
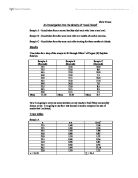
The two articles I will be comparing are from two different magazines, one a gossip magazine called ‘Reveal’ and the other a music magazine called ‘Kerrang!’. The first article from the ‘Reveal’ magazine has a main title of ‘I Beat Beyonce to No 1’ and has a total of 457 words, the second article from the ‘Kerrang!’ magazine is called ‘The Astonishing Rise Of Guitar Hero’ and has a total of 651 words. There is around a 200 word gap between the two articles, but because I am taking a percentage this shouldn’t make a difference in the final results. I am going to take 20% of the words from each article; this means I will be taking 91 words from the Reveal article and 130 words from the Kerrang! article. I will need to count every 5th word and count the number of letters in each word. Once I have collected the data I will record it in the frequency table below.
From this table I can now collect the mean, mode and median of the data which will hopefully show a difference in the average length of a word for each article.
To fine the mean of the data I need to take the sum of fx (∑fx) and divide it by the sum of f (∑f).
To find the mode for each article I need to find which of the number of letters has the highest frequency.
To find the median I will draw a cumulative frequency polygon; I will determine the median and Interquartile range of both sets of data.
Median:
To find the median from the cumulative frequency polygon I need to divide the total cumulative frequency from both articles by 2. To find the Interquartile range I will need to find the lower quartile, which is found by dividing the cumulative frequency total by 4, and the upper quartile is found by dividing the cumulative frequency total by 4 the multiplying it by 3. These calculations will now be plotted on the cumulative frequency polygon.
For the ‘Kerrang!’ article the median and Interquartile range are:
Median – 4.1
Interquartile Range = Upper Quartile – Lower Quartile = 6 – 2.7 = 3.3
For the ‘Reveal’ article the Median and Interquartile Range are:
Median – 3.6
Interquartile Range = Upper Quartile – Lower Quartile = 4.2 - 2.4 = 1.8
I have used the Interquartile Range rather than the range of the data, as the range is not as reliable, this is because it can be affected by very high and very low pieces of data whereas the Interquartile range is only the range between the first and third quartiles. This eliminates any outliers which may affect the data.
I will now put the average results into a table below.
The two articles have the same mode; however this does not represent the average properly as it does not use all of the data. The ‘Kerrang!’ article has a higher average of word length than the ‘Reveal’ article.