Results
After doing this experiment I have obtained the following weights of the sweets:
Galaxy minstrels (g):
Maltesers (g):
Mean, Variance and Standard deviation
Now that I have obtained all the weights of each individual sweet I will be able to calculate the mean, variance and standard deviation of the sample.
Mean (u)
The mean, u, is the sum of all the data values divided by the number of observations, it is a measure of the ‘average’ value of a set of data. The mean is equally influenced equally by all the data values. The formula for calculating the mean is:
u = ∑x
n
I will calculate the mean of the Galaxy minstrel’s and Maltesers separately.
Galaxy Minstrels u = ∑x = 261.41 = 2.61g (2 d.p)
n 100
Maltesers, u = ∑x = 202.32 = 2.02g (2 d.p)
n 100
Variance
The variance, o ², is calculated by taking the mean of the sum of the squared deviations from the mean. The formula to calculate variance is:
o ² = ∑x ² - x ²
n
I will once again calculate the variance of the Galaxy minstrels and Maltesers separately.
Galaxy Minstrels, o ² = ∑x ² - x ² = 684.2055 - 2.61²
n 100
= 6.842 – 6.812
=0.03 (2 d.p)
Maltesers, o ² = ∑x ² - x ² = 419.735 - 2.02²
n 100
= 4.197 – 4.080
= 0.12 (2 d.p)
Standard Deviation
The standard deviation, o , is the measure of spread around the mean. It is calculated using this formula:
o = /∑x ² - x ²
n
As you can see the standard deviation is simply the squared root of the variance:
√variance
As I have already calculated the variance it will be relatively easy to calculate the standard deviation (by square rooting the variance)
Galaxy Minstrels o = √variance = √0.03
= 0.17 (2 d.p)
Maltesers o = √variance = √0.12
= 0.35 (2 d.p)
Now that I have calculated the mean, variance and standard deviations of the Galaxy minstrels and Maltesers I will be able to compare them to do this I will place the results in a table as it will be easier to look at the data:
From the table you can see that the ‘average’ weight (or mean) of the Galaxy minstrels is higher than the mean weight of the Maltesers, this general shows that the Galaxy minstrels weigh more than the Maltesers.
The weights of the Galaxy Minstrels are more regular than the Maltesers this is shown by both the standard deviation and the variance. The variance and standard deviation of the Maltesers is a lot higher than the Galaxy minstrels. There would be a greater confidence in predicting the actual weight of a galaxy minstrel than the weight of a maltesers as the weights of the Galaxy minstrels are more tightly bunched together and therefore has less variation.
The weights of the Galaxy minstrels are 2.61g + 0.17g and the weight of Maltesers is 2.02g + 0.35g. Hence Galaxy minstrels generally weigh more.
The Normal Distribution
Normal distribution curves can be used as a model for the distribution of a number of continuous variables. Most distributions that occur are bell shaped, but before an accurate normal distribution curve can be drawn the data must be standardised.
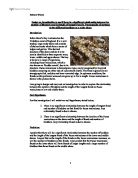
The Standard Normal distribution has a curve as shown below:
The standard normal distribution has a mean of 0 and a standard deviation 1, hence the area under the curve is 1.
The area under the standard normal curve to the left of a point (e.g. z) is denoted by (z):
The shaded area is would be calculated using the normal distribution tables.
Standardising data
As stated before to draw a suitable normal distribution curve the data being used must be standardised. This is calculated by using the formula:
Z = x – x
s
Where x is the mean, x is the observation and s is the standard deviation.
e.g. The standardised form of the first weight of a Galaxy minstrel is:
Z = x – x = 2.44 – 2.61
s 0.17
= - 0.17
0.17
= -1
This means that the weight 2.44g is 1 standard deviation units below the mean.
Normal Distribution Curve
When looking at the two sweets; Galaxy minstrels and Maltesers. I think that the normal distributions will be normal (bell-shaped) as these sweets are manufactured goods, hence, made by machines therefore the weights of each sweet will be very similar to each other and not have huge variations between them. So when a normal distribution curve is drawn it will be normal.
After standardising the data (as shown above) I was able to draw a normal distribution curve:
Galaxy Minstrels:
As you can see from the curve above the distribution of the galaxy minstrels is normal. I will now draw a normal distribution curve for the Maltesers:
The distribution of the Maltesers is also normal.
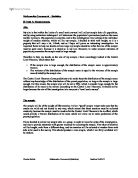
To compare the distributions of the two sweets I will place the two curves on the same axis, as shown below:
When the two curves are placed together it is obvious that the standardised weights of the Maltesers are more clustered around the mean than the Galaxy minstrels.
The Central Limit Theorem
The central limit theorem states that the mean of the sample is the same as the mean of parent population, it also states that the sample variance is the variance of the parent population divided by the sample size (as stated above).
The central limit theorem is crucial to work on sampling; it allows you to make predictions about the distribution of the sample without necessary knowing the distribution of the parent population.
An unbiased estimator is when the mean of its distribution is equal to the population value that it is estimating. Hence, the sample mean is an unbiased estimator of the population mean.
Population parameters
When looking at populations there are two types of populations to consider:
-
Parent population – this is the whole population e.g. all the galaxy minstrels ever made.
-
Sample population (sample means) – this is a small amount of the population.
These can be illustrated as:
The distribution of the sample means is normal; the mean of the distribution of the sample means is equal to the mean of the parent population, but the results for the sample are more clustered around it’s mean than the parent population this demonstrates that the sample has a small variance than the parent population.
Hence, mean, u, is the same for both and if the sample size, n, is given the variance will be o ²
n
Standard Error
The confidence of calculating the weight of a sweet is based on the variation of the weights, if there is less variation the confidence increases. This suggests that you might use the variance of the sample mean values as a measure of confidence.
When estimating the size of the sample and its standard deviation. The standard deviation of the mean is called the standard error. The standard error is calculated using the formula:
s.e. = o
√n
Using this formula I will calculate the standard error for both the Galaxy minstrels and the Maltesers.
Galaxy minstrel s.e. = o = 0.17 = 0.017 (2 s.f)
√n √100
Maltesers s.e. = o = 0.35 = 0.035 (2 s.f)
√n √100
Confidence Intervals
Confidence intervals are used as a ‘user-friendly’ way to express how confident you are in your estimate of a population mean. You can use the sample data to construct an interval estimate for the population mean.
Confidence intervals are calculated by using the standard error, mean and the normal distribution tables. This is shown in the formula:
% confidence interval = (sample mean – N.D.V * s.e, sample mean + N.D.V * s.e)
Where N.D.V is the normal distribution value.
Using this formula I will firstly calculate the 70% confidence interval for each of the sweets.
Galaxy Minstrels
70% confidence interval = (sample mean – N.D.V * s.e, sample mean + N.D.V * s.e)
= 2.61 – 0.525 * 0.017, 2.61 + 0.525 * 0.017
= 2.60, 2.62
This shows that there is a 70% confidence that the weight of a Galaxy minstrel weighs between 2.60g and 2.62g.
Maltesers:
70% confidence interval = (sample mean – N.D.V * s.e, sample mean + N.D.V * s.e)
= 2.02 – 0.525 * 0.035, 2.02 + 0.525 * 0.035
= 2.00g, 2.04g
This shows that there is a 70% confidence that the weight of a maltesers weighs between 2.00g and 2.04g.
Now I will find the 90% confidence interval of each sweet.
Galaxy Minstrels
90% confidence interval = (sample mean – N.D.V * s.e, sample mean + N.D.V * s.e)
= 2.61 – 1.645 * 0.017, 2.61 + 1.645 * 0.017
= 2.58, 2.64
This shows that there is a 90% confidence that the weight of a Galaxy minstrel weighs between 2.58g and 2.64g.
Maltesers:
90% confidence interval = (sample mean – N.D.V * s.e, sample mean + N.D.V * s.e)
= 2.02 – 1.645 * 0.035, 2.02 + 1.645 * 0.035
= 1.96g, 2.08g
This shows that there is a 90% confidence that the weight of a maltesers weighs between 1.96g and 2.08g.
Now I will calculate the 95% confidence intervals.
Galaxy Minstrels
95% confidence interval = (sample mean – N.D.V * s.e, sample mean + N.D.V * s.e)
= 2.61 – 1.96 * 0.017, 2.61 + 1.96 * 0.017
= 2.58, 2.64
This shows that there is a 95% confidence that the weight of a Galaxy minstrel weighs between 2.58g and 2.64g.
Maltesers:
90% confidence interval = (sample mean – N.D.V * s.e, sample mean + N.D.V * s.e)
= 2.02 – 1.96 * 0.035, 2.02 + 1.96 * 0.035
= 1.95g, 2.09g
This shows that there is a 95% confidence that the weight of a maltesers weighs between 1.95g and 2.09g.
Now I will calculated 99% confidence intervals
Galaxy Minstrels
99% confidence interval = (sample mean – N.D.V * s.e, sample mean + N.D.V * s.e)
= 2.61 – 2.575 * 0.017, 2.61 + 2.575 * 0.017
= 2.57, 2.65
This shows that there is a 99% confidence that the weight of a Galaxy minstrel weighs between 2.57g and 2.65g.
*****Maltesers:
70% confidence interval = (sample mean – N.D.V * s.e, sample mean + N.D.V * s.e)
= 2.02 – 0.525 * 0.035, 2.02 + 0.525 * 0.035
= 2.00g, 2.04g
This shows that there is a 70% confidence that the weight of a maltesers weighs between 2.00g and 2.04g.
Table