Again the results are very close.
I am confident that the sample matches up to the complete data. I will now continue with the investigation.
Hypothesis 1
I will investigate the hypothesis:
“The more lessons taken by a pupil the fewer mistakes they make in the test.’
I predict that this hypothesis is correct. This is because I think this because the more
you practice at something, generally the better you become at it hence the saying practice makes perfect. Therefore I anticipate that there is a negative correlation between number of lessons and number of mistakes.
To investigate this hypothesis, I will draw a scatter graph for the number of mistakes against the number of lessons
Scatter graph analysis:
The scatter graph shows a negative correlation between the number of mistakes and the number of lessons.
The equation of the line is y=-0.2118x+22.694.
The gradient (-0.2118 or m) means that for every 5 lessons taken the driver will make 1 less mistake (reducing 0.2118 of a mistake every lesson).
To find the how many lessons required to pass the test, I use the formula:
Y = mx + c
15 = -0.2118x+22.694
0.2118x = 22.694- 15
x = 7.964/0.2118
x = 37.60
This shows that generally speaking 38 lessons are going to be required in order to pass the test.
By using the intercept (c), I can estimate how many mistakes the average driver makes without any lessons. This means that the average person with no lessons makes 23 mistakes. To pass the test, the number of mistakes would need to be reduced by eight, hence -
P = 8x0.2
P = 40
It would take on average 40 lessons for a student to pass their test. This indicates that lessons are nearly not worth while because lessons can be about £50 each. It would cost the average person learning to drive, about £2000, which is a large sum of money, especially for students.
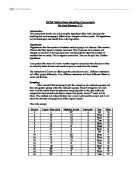
In the data, some of the driver’s are missing their “number of mistakes”. I will use my formula to fill in some of this missing data:
The results show that with my formula drivers 63, 74 and 216 failed their test. Only driver 118 passed.
Hypothesis 1 (“The more lessons taken by a pupil the fewer mistakes they make in the test’) is correct. This means that my prediction also correct.
I feel that gender would be a big factor. I think that females benefit more from lessons than males, because females in general, are more nervous and lessons would boost their confidence more than males. For hypothesise 2, I am going to investigate gender to see if females need more lessons than males.
Hypothesis 2
Females will benefit more from lessons than males.
I think that females will benefit lessons more because females are more nervous and lessons would help them to become more confident. I will draw two graphs, one for males and the other for females, to work out what gender benefits lessons the most. I am expecting that there will be a negative correlation in the scatter graphs and that the correlation will be stronger in the females’ trend line compared to the male’s trend line on the scatter graph.
I will sort my sample data into male and female drivers. I will produce a scatter graph for each gender so that I can compare my results easily.
Males
Here is a scatter graph showing the number of mistakes against the number of lessons for males who take their driving test. There is a steep negative correlation, which indicates that the number of lessons benefits males by a large amount.
The equation of the line is y=-0.5013x + 27.099. This gradient means that for every 2 lessons taken the driver will make 1 less mistake. (Reduces mistakes by 0.5013 every lesson)
The intercept means that with no lessons, an average male makes 27 mistakes.
For a driver who makes no mistakes in their test, the number of mistakes would need to be reduced by twelve.
P = 12/ (1/2).
P = 24
This means that it would take the average male driver 24 lessons to pass their test. This seems reasonable, lessons are beneficial for males.
I will now use my formula to fill in some of the missing figures that exist in the records:
Females
Above is a scatter graph showing the number of mistakes against the number of lessons for females who take their driving test. There is a very slight negative correlation that indicates that the number of lessons does not benefit females much.
The equation of the line is y=-0.0337x+20.987. This gradient means that for every 100 lessons taken the driver will make 3 less mistakes (reduce mistakes by 0.0337 each lesson). The intercept means that with no lessons on average 21 mistakes.
To pass the test the number of mistakes would need to be reduced by six.
P = 6/ (3/100).
P = 200
This means that it would take the average female driver 200 lessons to pass their test. This is a slightly strange result. Lessons seem to have hardly any impact for the average female.
These results would suggest lessons are not worth paying for!
I will now use my formula to fill in some of the missing figures that exist in the records:
The results from hypothesis 2 tell me that the average woman needs more lessons to pass her driving test, than the average male. This means that both the hypothesis and my prediction are incorrect.
Males may have preformed better because in general, males are more interested in mechanical things and are more confident than females.
Hypothesis 3
Depending on what instructor a pupil gets can have an impact on whether a pupil passes their driving test. The instructor’s approach to the pupil can have a large result on a pupil’s performance. I predict that for the majority of the instructors, males will perform better than females. This is because males in general, can be more outgoing and have more confidence than females.
I will sort my sample of data into instructor and gender. I will test this hypothesis by presenting the information in histograms. By doing this I can examine my results easily. I will ignore students with missing data, as this will make my results inaccurate
I will group the information into 4 different classes because of the wide range of values. The groups are shown below:
Histograms:
The two histograms look similar in shape. There are more males students that “passed comfortably” compared to females. There are a greater number of females that “just passed” compared to males. In total, 23 females passed and only 21 males passed. For both genders, 8 people failed. The total amount of people that “instructor A” taught is 60. he took 31 females and 29 males.
This time the two histograms look very different in shape. There is more than double the amount of males “passed comfortably” compared to females. More females “just passed” compared to males. There is a greater amount of females that “just failed” in contrast to males. Double the amount of females “failed badly against males. In total, 14 females passed and 35 failed. 24 males passed and 20 failed. Instructor B tutored 93 pupils.
The two histograms look quite similar in appearance. More females “failed badly”, “just failed” and “just passed” in contrast to males. This could be because instructor C taught 20 females and only 16 males. One more male “passed comfortably” compared to females. In total, 8 females passed and 12 failed. 8 males also passed but only 8 failed. Instructor C coached 36 pupils.
The two histograms look unlike each other, though they have comparable results. It seems that no females passed and only 4 males passed their test. 19 females failed and 15 males failed. More females “just failed” than males. Fewer males “failed badly” compared to females. The total number of male and female pupils which instructor D has is 38.
Using the frequencies from my histograms, I will work the probabilities out by using relative frequency. I can estimate the probability of passing or the probability of failing for each gender, with a certain instructor. I could also predict the average pass rate. With this method, my results will be far more accurate compared to just looking at the histograms.
To find the frequencies from the histograms, I will use the formula:
Frequency = Area…so
Frequency = width x frequency density
I will change result into percentage, so it is easy to compare results.
I will work out the frequency for the 4 classes and record my information on a table.
Males have preformed better than females for instructors B, C and D. Only for instructor A did females perform better males. Could this be because Instructor A is female? I.e. female pupils listen to female instructor more than males. Males only did worse than females by 2.2% for instructor A. For instructor B, males achieved 26.1% better than females. For instructor C, the difference between males and females was 10%. Males performed better than females by 21%.
I will now rank the instructors 1st – 4th for both genders.
Instructor A seems to influence both males and females the most, because s/he has the highest pass rate. This means that instructor A would be the best instructor to have if you were learning to drive. If I had to recommend a instructor, I would recommend him or her.
Instructor D doesn’t seem to help females at all,s/ he also influences males the least. This is because s/he has the lowest pass rate for both genders. Instructor D would be the worst instructor to have if you were learning to drive. To be quite honest it seems that s/he provides no help at all making him/her a waste of money. I would not recommend this instructor.
I was correct in saying that instructor would have an effect on how a pupil performs in their driving test. My prediction, that for the majority of the instructors, males will perform better than females is correct. Males performed better than females for 3 out of 4 instructors. I thought this because males in general, can be more out going and are more confident than females.
Conclusion
Firstly I made a sample that was stratified by gender and instructor. I did not think that choosing random data for a sample would be so accurate.
Hypothesis 1:
I decided to investigate in the hypothesis-“the more lessons taken by a pupil the fewer mistakes they make in the test.’ I predicted that this was accurate because generally, the more you practice at something, the better you become at it (Hence the saying, practice makes perfect). This turned out to be correct. I was surprised that there was not a strong negative correlation; hence it took 24 lessons in order for the average pupil to pass their test.
When working with number of mistakes and number of lessons, I came up with the idea that gender might have an effect, therefore I brought forward hypothesis 2.
Hypothesis 2:
Females will benefit from lessons more than males was my 2nd hypothesis. I thought that females would benefit more from lessons because females are more nervous and lessons would help them to become more confident. This turned out to be incorrect. Males benefited more than females. I was shocked to find that it would take 200 lessons for the average female to pass the test.
Given that lessons obviously had an impact on number of mistakes, I considered if the quality of the lessons made a difference, hence the quality of the instructor. This is where I established hypothesis 3.
Hypothesis 3:
Depending on what instructor a pupil gets, can have an impact on whether a pupil passes their driving test.
I finished in stating that my hypothesis 3 was correct and that I was correct in saying that for the majority of the instructors, males will perform better than females. Males performed better than females for 3 out of 4 instructors. I considered this because males in general, can be more out going and are more confident than females. Instructor A turned out to be the best instructor for both genders (72% of male pupils passed and 74% of females passed). However driving instructor A was unusual because females had a better pass rate than males.
If I were to do this investigation again, I would have a larger amount of data to make this investigation more reliable. I would also add more specific details, such as “the gender of instructor” , “month driving test was taken”, “cost of lessons”, “how long lesson lasts” and “how long did driver practice for test” These factors would help me investigate in more depth.