Prediction
I predict that the 3rd years will be more accurate than the 1st yrs, in estimating the size of the angle. The actual size of the angle is 160 degrees.
Results
1st Years
3rd Years
Tables for cumulative frequency graphs
1st Years:
3rd Years
Analysis
The 3rd year’s median was the same as the actual size of the angle. The 1st years median was 150, 10 below the correct size of the angle (160). The 3rd years have a higher range and a higher inter quartile range. The only evidence that shows that the 3rd years are more accurate than the 1st yrs is that the median is the same as the answer. However the 1st years have a lower range and more correct estimates than the 3rd years. The means of both years are fairly close the 1st years have a mean of 153.15 and the 3rd years mean is 158.85 as you can see in the above table.
Conclusion
I predicted that the older students (3rd years) would be more accurate in estimating the size of the angle than the younger students (1st years). My results show that my prediction is wrong because the 1st years have more correct estimates than the 3rd years and also the inter quartile range is 4 lower than the 3rd years. The 3rd years mean is also closer to the correct answer.
2nd Hypothesis
3rd year males are more accurate in estimating the angle than 1st year males.
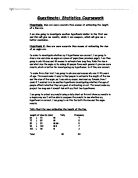
Plan
I will take 10 random male samples from the 3rd year and 10 random male samples from the 1st year out of a total of 292 individual sets of data. I will sort this data out and plot a cumulative frequency graph for each year.
I will use the same method for picking random samples as I did for my first hypothesis.
Results
1st Years
3rd Years
Tables for cumulative frequency graphs
1st Years:
3rd Years
Analysis
The 3rd year’s median is 158 and the 1st year’s median is 161.5, 3.5 more than the 3rd years. The 3rd years have a higher range but a lower inter quartile range. The median for both 1st and 3rd years isn’t that much off the correct estimate. 1st years are 1.5 off it and 3rd years are 2 off it. The 1st year males mean is 162.1 and the 3rd year males mean is 156. The 1st year’s male mean shows that it is closer to the correct answer than the 3rd year males.
Overall Conclusion
1st years are more accurate than 3rd years in estimating the angle, but the 1st years males are more accurate than the 3rd year males (only just). The medians are about the same for 2nd hypothesis but overall the 3rd year males had more correct estimates than the 1st year males.
Evaluation
Overall I think that my investigation went reasonably well. The way in which I got the samples was a good way of choosing random samples and it worked well.