A pilot study was performed and the questionnaire re designed accordingly. The resulting questionnaire was then administered. The quantitative data was analysed in order to establish the correlation coefficient, the strength of the correlation, which was then statistically tested for significance. The qualitative data was analysed and findings compared to the quantitative data. An opportunity sample of 21 participants made up of 20 females and 1 male agreed to take part. The group consisted of first year students on degree programs within the West Suffolk College. Eleven of the participants were Humanities degree students and 10 were Behavioural Studies and the ages ranged from 19 – 41+. Standard forms (appendix 1-3) were produced in order to make replication of the survey possible. These included an information/consent form (appendix 1), a request for further information form (appendix 2) and a self-complete questionnaire (appendix 3).
A group of 1st year undergraduate students were approached within designated lecture time and invited to take part in a student satisfaction survey. An ethically approved information/consent form was issued and the students were asked to read through and sign it to give their consent. An additional form was provided to collect the details of those who wanted further information on the survey or a copy of the research findings. The respondents were informed that the whole process would only take about 10 minutes and their responses would remain entirely confidential. The purpose of the survey was explained briefly although no mention was made with regard to the self-esteem aspect of the questions. Participants were also informed of their right to withdraw at any time and asked if they had any questions prior to proceeding.
Results
Descriptive statistics
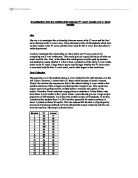
Table 1
Table 1 lists the program of study, age group and gender of the 21 respondents. It also lists the total scores for satisfaction and self-esteem taken from the quantitative part of the questionnaire together with the mean and standard deviations. The table also includes the individual respondents positive word scores, which were derived from the qualitative data collected. The final column details the respondent’s long-term goal, which was part of the demographic section of the questionnaire and shows that 8 out of the 21 respondents aim to go into teaching, 3 respondents hoped their degree would lead onto a job but did not specify the type of job. 3 respondents said they would like to undertake a Masters degree and/or go into Educational Psychology. 3 respondents reported that gaining a degree was their long term goal, 1 of whom is aiming for a first class honours degree. The 4 remaining respondents said they were unsure, open-minded or had no long-term goal. Generally satisfaction scores tended to be high with a mean score of 13 (the lowest possible score being 4 and the highest 16). Deviation from the mean was minor with a standard deviation of 1.6 for satisfaction and 2 for self-esteem.
SPSS was used to calculate the correlation, which is illustrated in the scatter gram in appendix 4. Correlation measures the extent to which the self esteem and satisfaction scores tend to change together or ‘co-vary’. Appendix 4 illustrates the strong positive correlation found with the self esteem and satisfaction scores. Regression analysis estimates the best fit of the line through the scatter of related pairs. SPSS generated descriptives showing the scores, mean and standard deviations for both self esteem and satisfaction broken down into age groups can be seen in appendix 17.
Fig. 1 Breakdown of Scores by Age
Fig 1 Compares the means scores for self-esteem and satisfaction and breaks them down into the separate age groups. See appendix 16 for SPSS generated age, score summary. Self-esteem scores vary from mid to high. The greatest difference in scores can be seen in the 22-31 age group. The scores were also analysed in terms of the program of study in order to see if there was any difference between the responses of the behavioural studies and humanities students (see appendix 7) in which case little difference was found.
Inferential statistics
In order to determine any significance in the correlation, Pearson’s Product Moment parametric test was applied. This test was selected, as it is the most appropriate for use with the interval data generated by the self-esteem and satisfaction scales used in this study. SPSS was used to calculate the level of significance. (See appendix 6) The results displayed in table 2 below, show the correlation to be significant at the 0.01 level thereby confirming that the null hypothesis may be rejected. (Coolican, 1999).
Table 2
Analysis
The qualitative data discussed below has been taken from the responses to three questions. In the first, respondents were asked to list 5 words, which they felt best describe the person they are. See appendix 8. The words were then analysed and common themes drawn out. Appendix 9 is a table showing the chosen words in order of most frequently used. The words were broken down into the following categories, positive, negative and neutral, low self-esteem and high self-esteem. Appendix 10 includes a bar chart showing the resulting breakdown. Of the 105 words in total used by the 21 respondents, 51 words were classified as positive and only 4 were classified as negative. The two pie charts in appendix 10, illustrate the breakdown of high self-esteem and low self esteem words used. These findings clearly reflect a high level of positive self-description by respondents and a very low negative self-description. Friendly, confident and content were the most frequently used high self-esteem words and self-conscious was the most frequently used low self-esteem word. The comparison between the number of high and low self-esteem words in the bar chart (appendix 11) serves to further illustrate the strength of self-esteem in the respondents.
The second question focused on the best and worst things about college. Transcripts of the respondent’s comments can be seen in appendix 12. Common themes were drawn from the transcript and detailed in the table shown in appendix 13. It was observed that the number of positive comments, which totalled 40, far outweighed the negative comments which totalled 25, thus further supporting the view that students are generally satisfied with their college experience. Two bar charts were created to illustrate the findings. See appendix 14. Finally, the third question was–‘What do you hope to have achieved on completion of the course?’ Transcripts may be seen in appendix 15. Respondent’s comments fell into 2 main categories, that of achievement of the degree course and secondly that of self-fulfilment. Further analysis is required in order to identify any possible meaning behind this.
In reviewing the qualitative data sets and comparing them with the individual scores for satisfaction and self-esteem a common theme is revealed. The 4 respondents with the highest scores for self-esteem and satisfaction, (respondents nos. 2,11,12 and 17 highlighted in yellow on table 1), tended to have more specific and ambitious long-term goals. For example, respondent 11’s long-term goal is to go on to achieve a ‘Masters in Psychology’ and respondent 17’s goal is to gain a ‘first class honours degree’. In contrast the 4 respondents with the lowest scores (nos. 5, 8, 10 and 21 highlighted in green) had much less ambitious and specific long term goals. Respondent 8 who scored the lowest out of all the respondents for self-esteem replied ‘not sure if I will even complete the course’. From this it is possible to argue that those with higher esteem tend to be more ambitious and more specific in their goals. This would concur with the findings of Baumeister, Rice and Hutton (1989) in regard to motivational orientation.
Discussion
The intention of this research was to address the hypothesis that there is a significant correlation between levels of self-esteem and levels of undergraduate satisfaction. Statistical testing has demonstrated a significant correlation between these two variables and this has been further supported by the more descriptive data provided by each respondent.
The strengths and weaknesses of the method, sample and application will now be reviewed. The method of accessing the sample was efficient in terms of response rate. The aim was to obtain 20 completed questionnaires. 25 questionnaires were issued thus allowing for up to 5 spoiled or withdrawn question sheets. 21 completed questionnaires were returned along with their corresponding information/consent forms correctly signed. The high rate of respondents may have been affected by an element of conformity pressure. The lecture theatre location and timing were conducive to the high response rate and the fact that the lecturer introduced the researcher and clearly gave her approval further encouraged co-operation. It also meant that all the respondents were subject to the same external conditions. Despite the possible pressure to take part, the respondents may have felt uneasy about writing their answers in the close proximity of their classmates; this could alter the responses given and thus the reliability of the study. By capturing an audience in this opportunist way, one inevitably ends up with an unrepresentative sample. In this case a group of students from a limited no of courses namely Humanities and Behavioural Studies Degree programmes. They were all first years and all but one, female. These imbalances are bound to bias the results. The program of study a particular student may be studying is likely to have an effect, however little difference in responses could be identified between the Humanities and Behavioural Studies students. It would however be dangerous to assume that this would be the case across all undergraduate subjects. It can argued that Humanities and Behavioural studies subject may attract similar types of students and the views or experiences of an undergraduate engineering group for example, may vary considerably.
The focus of the study is concerned very much with general overall satisfaction with college experience. It has deliberately steered away from specifics such as satisfaction with individual modules, methods of delivery and course content. The open ended questions have however highlighted a host of factors affecting satisfaction which have not been fully analysed in this case. The findings have simply been used to indicate general levels of satisfaction. The self esteem aspect of the study has revealed that in this research sample levels of self-esteem scores range from mid to high with no scores indicating low self-esteem. A possible explanation for this may be that few people with low self-esteem would even consider attempting a degree course in the first place. Further investigation may shed more light on this possibility.
It has proved useful to have a mix of data in order to gain a more balanced view. There was a tendency for some respondents to tick the same response column to all quantitative questions. This happened in 4 cases. This could mean that the respondent felt that the same answer applied to all questions or they were just arbitrarily ticking the same box with little thought. Bryman (2001) describes this as acquiescence, the tendency for people to consistently agree or disagree. One way to identify if the respondents are really reading the questions and answering accordingly is to include the odd reversed score question. The option to split the order of questions to avoid possible order affects was considered, should the study be taken further this may well be worth consideration. A minor level of deceit was employed in that respondents were not informed about the self-esteem aspect to the study. This was considered to be of minimal ethical consideration and acceptable in order to prevent any affects resulting from the participants knowing that their self-esteem was the subject of the study. This study also notes that 13 respondents completed the further information form requesting a copy of this report.
Conclusion and Implications
This study has established a relationship between satisfaction and self esteem in that those with higher self-esteem have reported greater satisfaction with their college experience compared to those with lower self-esteem. This has been demonstrated through a significant, strong, positive correlation of the variables supported by qualitative data. It must however be noted that the correlation of these factors does not imply cause and effect. In other words it can not be concluded that one has an effect upon the other. It is also impossible to state with any authority that those with higher self-esteem tend to be more satisfied with their college experience across education as a whole. The sample in this study is too narrow to make that assumption. The possibility that college life only appeals to those with higher self-esteem can not be ignored either. It may be the case that Higher education may not attract those with low self-esteem. It has been established through the literature that self-esteem is a useful trait to possess. Baumeister (1999) suggests that raising self-esteem could bring about dramatic improvements to both the individual and society as a whole. Inclusion and lifelong learning are driving forces throughout education today. Watson and Taylor (1998). Perhaps by attempting raise levels of self esteem from an early age access to higher education may be increased.
References
Academic definitions (2004) [online] www.brainydictionary.com/words/defin/satisfaction.htm
(Accessed 17/10/2004)
Baumeister, R. (1999) The Self in Social Psychology. Philadelphia: Psychology Press
Brown, G. et al. (1997) Assessing Student Learning in Higher Education. London: Routledge
Bryman, A (2004) Social Research Methods, (2nd ed.): Oxford: Oxford University Press.
Coolican, H (1999) Research Methods and Statistics in Psychology, (3rd ed.): London: Hodder and Stoughton.
Curry and Johnson (1990) Self esteem and successful early learning.
Durkin, K. (1995) Developmental Social Psychology: from infancy to old age. Oxford: Blackwell Publishing.
Eysenck, M. (2000) Psychology, a student’s handbook, Hove: Psychology Press Ltd.
Gross, R. (1996) Psychology: the Science of Mind and Behaviour. (3rd ed.): London: Hodder and Stoughton.
Hayes, N. (2000) Foundations of Psychology. (3rd ed.): London: Thomson Learning.
Lee et al (1999) Factors Related to Student Satisfaction with University. [on line]http://www.qut.edu.au/talss/fye/papers/JollyPaper.doc (accessed 16/11/2004)
Malley, J. (1998) The Measurement and Meaning of Student Satisfaction: A Review. Melbourne: ACER.
May, T. (2003) DSE212 Exploring Psychology Methods Booklets 4 & 5. UK: OU Publication
Postema, M. and Markham, S. (2001) A Methodology for Subject Evaluation: Defining Student Satisfaction. [on line] (accessed 17/10/2004)
Rosenberg, M. (1965) Society and the Adolescent Self Image. Princeton: New Jersey Princeton University Press.
Rosenberg, M (1965) Self Esteem Scale [on line]
)
Watson, D and Taylor, R. (1998) Lifelong learning and the University: A Post-Dearing Agenda. London: The Falmer Press