Investigating Growth in Stride Length During the Human Growth Stage
Aim
The aim of this investigation is to test the hypothesis that the stride length of a human being, during its growth stage, increases as they age. I chose to investigate pupils in years 7 and 12 at my school as their ages are far enough apart to produce data that should show significant changes in stride length.
This investigation was initially prompted by personal experience, because at age 17 my relatively short legs and stride have caused me problems in driving and purchasing clothes. It would seem that manufactures are not catering for people of my size/age, as they appear to be basing design decisions on data that is producing a 'mean' that discriminates against myself and others.
Data Collection
The population for my investigation is all the pupils in years 7 and 12 at my school, which is an all girls' school. Restricting my selection to just girls in my school has not sacrificed quality because it would have been misleading to include male measurements in the data as they have very different growth patterns. Also my school has a good representation of girls of the same age ranges. I chose a sample of 30 pupils from each year group using systematic sampling. I chose this method of sampling as simple random sampling would have been very tedious and time consuming because I would have had to number all the pupils in each year and then produce 60 random numbers. Also the numbers of pupils in each year group are of very similar sizes so stratified sampling would not have been of any use. The sampling frame that I have chosen to be a representation of the population, is a class list arranged alphabetically for both years 7 and 12.
YEAR 7
Total number of pupils= 150
Sample size= 30
150/30= 5
Random number from 1 to 5 on calculator= 2
I therefore chose every 5th member of the population starting from the student numbered 2 in the class list, e.g. 2, 7, 12, 17 etc.
YEAR 12
Total number of pupils= 145
Sample size= 30
145/30= 4.83 = 5 (1 significant figure)
Random number from 1 to 5 on calculator= 3
I therefore chose every 5th member of the population starting from the student numbered 3 in the class list, e.g. 3, 8, 13, 18 etc.
Since the alphabetical lists of students have no significance to the length of the student's strides the sample may be considered random.
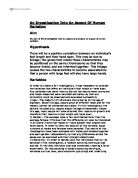
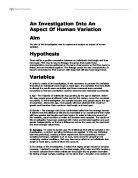