The names of the students are not here, due to confidentiality. Also, all the above marks are out of 100. However, as the results are taken over 5 years there was a change made to the maths A-level specification during 2001. This resulted in each module being marked out of 100 instead of 70. Therefore I had to convert all the marks to 100, which was done using the following formulas:
This could create some bias, however, because the new syllabus may be more difficult than the old one as the number of marks have increased. Hence, students may gain lower marks in the new syllabus.
Analysis
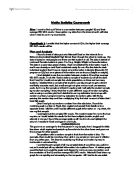
From the data a scatter graph can be drawn to shown to show the correlation between P1 exam results and A-level result. This is shown below:
We can see that the majority of the data points lie within the top right and bottom left quadrants indicating a positive correlation. Also, an ellipse can be drawn around the data points so I can assume the data is from a bivariate normal distribution. As both P1 exam result and A-level result are assumed to be random results which follow the normal distribution a Pearson’s product moment correlation coefficient would be appropriate. This could be followed by a hypothesis test.
The Pearson’s correlation coefficient ‘r’ will give me a value between 1 and -1 which will indicate how correlated the two variables are. A value of 1 would mean perfect correlation and a value of -1 would mean no correlation at all.
This is worked out using the following steps with Excel:
Covariance of the data = 109.2012
Standard deviation of x = 13.70535
Standard deviation of y = 11.07421
Correlation coefficient,
= 109.2012 = 0.719489
151.7759
This value was also calculated on the Excel spreadsheet and gave the same answer. As we can see, this firmly indicates that there is positive correlation. However, this is my informed opinion, in order to get a more definitive answer to whether these two variables are correlated a hypothesis test must be performed
The data used to calculate r is actually a sample of the parent bivariate distribution, i.e. only a few out of a large number of points on the graph are taken. There will be a level of correlation within the parent population and this is denoted by ρ. My value of can be used as an estimate for ρ. It can also be used to carry out a hypothesis test on the value of ρ.
My starting hypothesis, the null hypothesis (H0), is that there is no correlation between the P1 results and A-level results in the population, my alternative hypothesis (H1) is that there is some positive correlation.
H0: ρ = 0
H1: ρ > 0co
A test at the 5% significance level will be sufficient to show correlation. The tables of pre-calculated critical values found in the MEI student handbook were required. From these the critical value of the Pearson's product moment correlation coefficient for 50 sets of data at one tail at 5% significance is 0.2353.
My value of r 0.798922 is clearly greater than 0.2353, so the alternative hypothesis is accepted which means at this significance level the data is positively correlated. To confirm this further I will carry out the test at lower significance level.
The lowest I can test at is the 0.5% significance level and this gives me a critical value of 0.3610. Clearly my r value is still higher than this, hence showing a very strong indication of positive linear correlation.
Interpretation
From my results I am very confident in concluding that the results of the P1 exam are positively correlated with the A-level exam results. This was first seen on the scatter graph which showed positive linear correlation. There was further evidence for this after calculating the Pearson’s correlation coefficient and carrying out the hypothesis test. The correlation coefficient compared with the critical values was greater (0.7989 > 0.2353) at the 5% significance level. The same was true also for the 0.5% significance level (0.7989 > 0.3610). This means that the alternative hypothesis is accepted, i.e. there is positive linear correlation. Also, as there is a large difference between the two values this indicates that the correlation is very strong.
Therefore I am confident in my conclusion that the result in the P1 exam is a good indication of the final A-level result. This fulfils my original aim of investigating this relationship. This conclusion was likely to be expected because students who have performed well in the P1 exam will most likely continue their efforts over the whole A-level course. However, this will not always be true, the result is an estimate and an average, and there will be exceptions of course. For example, one student (number 33) from my sample obtained 53% in his P1 exam and overall in the A-level obtained 79%. This is a large improvement and obviously does not agree with my conclusion. These results also do not take into account re-sits, which certainly help students to improve their marks.
I am convinced this conclusion can be applied to students at Trinity School. I also believe it can be applied to the population as it is very unlikely that the correlation would change significantly even though there are several bias factors. These are discussed further in the next section. Also, gaining a good grade P1 exam does not imply that a student will gain a good A-level result. These two variables are correlated and one does not cause the other.
Accuracy and Refinements
My population sample is taken from a boy’s independent school. This excludes girls which could possibly affect the results, for example girls may tend to improve more after a poor P1 result or the opposite may be true. Also, I have taken results from the MEI syllabus which could also lead to some bias because other syllabuses may be different and possibly harder. Also, considering that I have taken results from independent school, these would differ from results from a grammar school or sixth form college. The standards in independent schools are much higher and it would be assumed that these pupils would be gaining higher marks. This also would introduce some bias. The other main problem encountered was that the MEI syllabus changed over the 5 years. I overcame this problem by converting all the marks to out of 100; however, there could still be some bias.
All these factors could effect the correlation, however, I still believe that there would still be positive correlation for my population. If I had more time and money, there would be several ways in which I could improve this investigation. Firstly, I would be able to collect more data from other schools, such as grammar and colleges. This would also include female students too. Also, I could select schools or colleges which take a different exam board. This would give a better sample population which would take into account these bias factors.