Part II
Investigate the graphs of y=sin (b∙x)
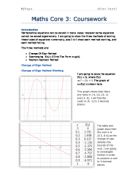
Figure #4: Comparison of graphs of y=sin(x); y=sin (2x) and y=sin (4x).
According to Figure#4, as the value of “b” increases from 1 to 2, as indicated by the red graph [y=sin(x)] and blue graph [y=sin(2x)], one complete cycle of the blue graph (1pi radians) only occupies ½ of the period of the red graph (2pi radians). Similarly, when compared the red graph [y=sin(x)] to the green graph [y=sin (4x)], one complete cycle of the green graph (0.5pi radians) only occupies ¼ period of the red graph (2pi radians).
Conjectures:
(a)
Transformations of the standard sine function y=sin (b∙x) by different values of “b” stretches horizontally the original function y=sin (b∙x)’s period by the inverse of the value “b”. For instance in the function y=sin (2x), this graph’s period per one complete cycle is shortened by inverse of 2, which is 1/2. Thus the period of the function y=sin (2x) is ½ of the original function y=sin(x). Varying values of “b” changes the frequency of the function changes as well. Frequency is the # of waves that fit in a fixed period. For instance in the example of y=sin(2x), this is horizontally compressed by a factor of 2, which means the period of 2pi radians has two complete cycle within this new function. Compared to the original function y=sin(x), y=sin(2x) has a higher frequency.
(b)
As the value of “b” increases, each wave’s period of this function compresses horizontally along the x-axis. It can be easily observed that varying values of “b” do not change the amplitude of the graphs as the graphs in Figure #4 have the same amplitude. When horizontal compression occurs, the function’s frequency is changed as well. Based upon the observation that varying values of “b” only changes the value of the period per complete cycle (which also is frequency), then it can be conjectured that when the value of “b” changes, the period of each complete cycle stretches horizontally along x-axis according to 1/b. The exact value of a stretched period of one complete cycle (two wave peaks or 2pi radians) can be obtained by the formula 2pi/b.
Part III
Investigate the family of curves y=sin(x+c)
Figure#5: Graphs of different functions of the family curve y=sin(x+c): y=sin(x); y=sin[x+ (pi/4)] and y=sin[x-(pi/4)].
According to Figure #5, a change in the value of “c” shifts the entire function to the right or left of the origin; this is called a phase shift. When the red graph (y=sin(x) original) is compared to the blue graph [y=sin(x+ (pi/4)), the blue graph shifted 1/4 pi to the left while the length of each period and the amplitude remained the same with y=sin(x). When the red graph (original y=sin(x)) is compared to the green graph [y=sin(x-(pi/4)], the green graph is shifted 1/4 pi radians to the right while the length of each period and the amplitude remained the same with y=sin(x).
Conjectures
(a)
Based upon the observation above the transformation of the basic function f(x) = a∙sin (bx+c) +d with varying values of “c” is a horizontal translation along the x-axis; the direction of the translation is dictated by the zero of “c” in the angle (bx+c). For instance the zero of (bx+c) is –c, which means a horizontal translation along the x-axis to the left; vise versa if the zero of the bracket produces +c, the translation would be towards the right. The value of this horizontal translation is the vale of “c”. Since the values of the amplitude and period/complete cycle, the frequency remains the same when “c” is the only value changed.
(b)
As the value of “c” changes the form of wave stays the same as shown clearly in Figure #5 (each complete cycle of all graph is 2pi radians and amplitude is +/- 1). Therefore based upon the observations the following points can be conjectured:
- varying values of “c” only changes the position of the waves in a horizontal translation along the x-axis while the amplitude and period remain the same with the original function
- the value of c tells how much each wave moves
-
The sign of “c” of the zero of (bx+c) dictates the direction of translation of the waves; positive “c” tells the wave to move to the right (in reference to y=sin(x).); negative “c” tells the wave to move to the left (in reference to y=sin(x)).
Continuation from Part I–III:
For the sake of a clear and easier understanding of the sine functions, the reflections of the sine functions will be explained here.
Sine functions of y=-sin(x) and y=sin (-x) are investigated:
Figure #6: Graphs of the sine functions of y=sin (-x) and y=sin(x)
The blue graph y=sin (-x) is the exact x-axis reflection of the red graph y=sin(x) with the same period and amplitude. The observation shows when a negative sign is placed in front of the angle, x, the resulting graph is the reflection of the original function (in this case, y=sin(x)) along the x-axis.
Figure #7: Graphs of the sine functions of y=-sin(x) and y=sin(x).
Figure # 7 is identical to Figure #6. This observation shows the position of the negative sign in front of the function produces the same results as would placed in front of the angle, x.
Part IV
Predictions:
Note: all predictions are measured in comparison with the original function y=sin(x)
Prediction #1:
Based on the exercises in the previous activities the function y=3sin2(x+2) has an amplitude of +/-3, the period for one complete cycle is 1pi radians and is translated 2 units to the left in reference to y=sin(x).
Prediction #2:
Based on the exercises in the previous activities the function y=½ sin3(x+1) has an amplitude of +/-0.5, the period for one complete cycle is 2pi/3 and is translated 1 units to the left in reference to y=sin(x).
Prediction #3:
Based on the exercises in the previous activities the function y=-sin½(x-1) is the reflection of y=sin½(x-1) along the x-axis which has an amplitude of +/-1, the period for one complete cycle is 4pi radians and is translated 1 units to the right in reference to y=sin(x).
Observation:
Figure #8: Graphs of sine function y=3sin2(x+2) and y=sin(x)
Figure #9: Graphs of sine functions y=½ sin3(x+1) and y=sin(x)
Figure #10: Graphs of sine functions y=-sin½(x-1) and y=sin(x)
All predictions matched.
Summary
- |a| dictates the amplitude or the height of each wave.
- -a or –x tells to reflect the function over the x-axis
- The value of “b” is the horizontal stretch factor of the graph along the x-axis. The stretch factor is used as 1/b. The new period can be calculated from 2pi/b.
- The phase shift represented by “c”. Varying values of “c” tell how much each cycle shifts along the x-axis. The sign of “c”, after taken out as the zero of (bx+c), tells the direction of the phase shift; positive “c” indicates a phase shift to the right and negative “c” indicates a phase shift to the left.
Part V
How is y=cos(x) related to y=sin(x).
Figure #11: Comparison between the standard sine graph: y=sin(x) and the standard cosine graph y=cos(x)
According to Figure #11, the standard cosine graph y=cos(x) is a horizontally translated of the standard sine graph y=sin(x) to the left by pi/2 radians. To test this hypothesis the standard cosine graph is shifted pi/2 radians to the right in the equation y=cos(x-(pi/2)) and this graph is compared to the standard sine graph. If y=cos(x) is nothing but a horizontal translation of pi/2 radians to the left of y=sin(x), then sin(x) =cos(x-(pi/2)).
Figure #12: Graphs of the function y=cos(x-(pi/2)) and y=sin(x)
According to Figure #12, the standard sine graph y=sin(x) = a horizontally translated to the right by pi/2 radians of the standard cosine graph y=cos(x). Based upon the Figure #11 and Figure #12, I conclude that cosine graph has the same amplitude and period/complete cycle as the standard sine graph; cosine is horizontally translated pi/2 radians to the left in reference to y=sin(x).
Based upon the properties observed two relations are obtained:
sin (x)=cos(x-(pi/2))
cos (x)=sin(x+(pi/2))
By combining the properties of the reflection on the x-axis and translation by the standard sine function y=sin(x), the standard cosine function y=cos(x) can also be obtained.
Figure #13: Graph of y=-sin(x-(pi/2)) and y=cos(x)
According to Figure # 13, the reflection on the x-axis with horizontal translation to right (by pi/2) by the sine function is the same as y=cos(x). Therefore based upon the properties gathered from Figure #13, two relations are obtained:
cos (x)=-sin(x-(pi/2))
sin (x)=-cos(x+(pi/2))