Introduction
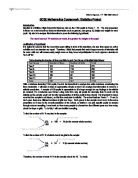
I have been asked to compare 173 year 7 pupils and 178-year 11 pupils who were asked to estimate the length of a bamboo stick to the nearest centimetre, which was held horizontally not vertical. I am going to investigate the two different age groups to see who had the more constant guesses from the secondary data, I have been given. The actual length of the bamboo stick is 1.58 metres. As 351pieces of data would be too big to sample, I am going to random sample 50 pieces of the data for each year. Not to be biased I am going to stratify my data to keep the boys and girls in proportion.
Hypothesis 1
I predict that the ability to accurately guess the length of the bamboo stick will increase by age group; this implies to me that the overall average year 11 guess will be close to the actual length than the overall average of the year 7 guess. I think this because as the year 11 pupils are older they would have had more experience with numeric problems and would be more mature than those in year 7 would. With this, I expect there to be more extreme data from year 7 than year 11.


