I have chosen to do random sampling; this is because it was the most appropriate.
I tried systematic sampling and here were my results:
I took a systematic sample, I took every 10th pupil, and it didn’t work. This was because as you can see in the table that all the results were in order, the sample wouldn’t be correct because it would be too wide as results from the beginning to the end are sampled. Also when you take every 10th pupil, you have the possibility that it will not be the sex that you are sampling at that time, e.g. in the table you can see that there are more males which were tested than females. Because the results are all in order before the sample was taken the results for males and females come out very similar.
Attribute sampling was another that didn’t work. I took a sample of every pupil born in the first month the CATs results were as followed:
As you can see, there were not as many females as there were males, to do the sample on. So, this way of sampling would not be accurate.
I did not do a stratified sample, this was because I am comparing boys against girls, therefore it would not work if I took ‘200 girls’ and ‘100 boys’ because it wouldn’t be a fair sample if there were more girls than boys that were sampled.
I calculated the mean, mode, median and range for the population; therefore I could compare my samples to see if they were accurate to it.
Females
Males
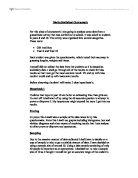
This is a cumulative frequency graph for the average CATs scores by females.
This is a box plot for the average mark of female CATs scores.
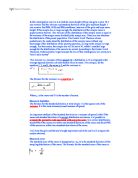
Here is a cumulative frequency graph of male CATs results.
This is a box plot for the average marks of male CATs scores.
From the box plots, you can see that the mean CATs score for females is slightly higher than the males. The female scores are more spread out, so it seems that the males are more consistent, as the marks are closer together. Although the females have higher marks than the males, more of the male marks are higher scores, so are more likely to get a better mark.
It is hard to compare this data, as there are a different number of males as there are females, but it looks as if they are nearly equal between 5-7, while with boys they are more likely to get 5-6. The males have more lower scores than the females, but the males have more scores which are in the middle. The flatness of the female graph shows that about the same amount of people get lower, middle and higher grades.
Here are the results from my random samples:
Here is another random sample:
Here are my final results:
The average of the samples are as follows:
Conclusion
I have decided that there is not enough data to come to a conclusion. This is because all the data is too similar. Also, it is very hard to compare data when there are more males than females.
As you can see by the grades, on average the girls do obtain better grades than the boys. The two highest marks were by females, and the two lowest marks were by males.
Although the range for the females is higher than the males, this could indicate that the scores are low and are similar, while the females have some higher marks, which make it a higher range when comparing them with the other marks.
As the range of the females is higher than the males, this could also indicate that the females get a few high marks and most of them in the middle and bottom.